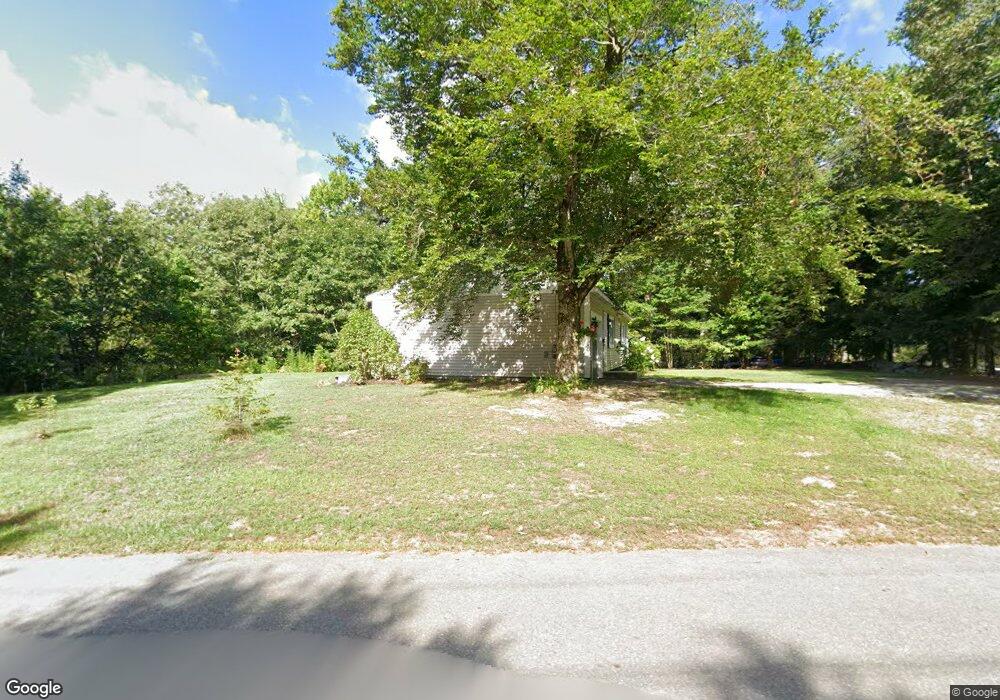
84 Swan Point Rd Rindge, NH 03461
Estimated Value: $372,000 - $391,343
3
Beds
1
Bath
1,270
Sq Ft
$299/Sq Ft
Est. Value
About This Home
This home is located at 84 Swan Point Rd, Rindge, NH 03461 and is currently estimated at $379,836, approximately $299 per square foot. 84 Swan Point Rd is a home located in Cheshire County with nearby schools including Rindge Memorial School, Conant Middle High School, and Conant High School.
Ownership History
Date
Name
Owned For
Owner Type
Purchase Details
Closed on
Sep 12, 2025
Sold by
Hill Jordan D and Hill Raakel R
Bought by
Botty Lynda I and Botty Carl P
Current Estimated Value
Home Financials for this Owner
Home Financials are based on the most recent Mortgage that was taken out on this home.
Original Mortgage
$100,000
Outstanding Balance
$98,814
Interest Rate
6.58%
Mortgage Type
New Conventional
Estimated Equity
$281,022
Purchase Details
Closed on
Aug 28, 2015
Sold by
Aho Raphael T
Bought by
Hill Jordan D and Hill Raakel R
Home Financials for this Owner
Home Financials are based on the most recent Mortgage that was taken out on this home.
Original Mortgage
$90,100
Interest Rate
4.09%
Mortgage Type
New Conventional
Purchase Details
Closed on
Jun 8, 2015
Sold by
Cormier Jonarthur
Bought by
Aho Raphael T
Create a Home Valuation Report for This Property
The Home Valuation Report is an in-depth analysis detailing your home's value as well as a comparison with similar homes in the area
Home Values in the Area
Average Home Value in this Area
Purchase History
| Date | Buyer | Sale Price | Title Company |
|---|---|---|---|
| Botty Lynda I | $377,000 | -- | |
| Botty Lynda I | $377,000 | -- | |
| Botty Lynda I | $377,000 | -- | |
| Hill Jordan D | $92,933 | -- | |
| Hill Jordan D | $92,933 | -- | |
| Aho Raphael T | $80,000 | -- | |
| Aho Raphael T | $80,000 | -- |
Source: Public Records
Mortgage History
| Date | Status | Borrower | Loan Amount |
|---|---|---|---|
| Open | Botty Lynda I | $100,000 | |
| Closed | Botty Lynda I | $100,000 | |
| Previous Owner | Aho Raphael T | $90,100 |
Source: Public Records
Tax History Compared to Growth
Tax History
| Year | Tax Paid | Tax Assessment Tax Assessment Total Assessment is a certain percentage of the fair market value that is determined by local assessors to be the total taxable value of land and additions on the property. | Land | Improvement |
|---|---|---|---|---|
| 2024 | $4,685 | $185,100 | $56,400 | $128,700 |
| 2023 | $4,635 | $185,100 | $56,400 | $128,700 |
| 2022 | $4,129 | $179,300 | $56,400 | $122,900 |
| 2021 | $4,061 | $179,300 | $56,400 | $122,900 |
| 2020 | $4,025 | $179,300 | $56,400 | $122,900 |
| 2019 | $3,734 | $134,500 | $46,500 | $88,000 |
| 2018 | $3,699 | $134,500 | $46,500 | $88,000 |
| 2017 | $3,657 | $134,500 | $46,500 | $88,000 |
| 2016 | $3,754 | $134,500 | $46,500 | $88,000 |
| 2015 | $3,751 | $134,500 | $46,500 | $88,000 |
| 2014 | $3,519 | $135,200 | $52,000 | $83,200 |
| 2013 | $3,399 | $133,500 | $52,000 | $81,500 |
Source: Public Records
Map
Nearby Homes
- 46 Swan Point Rd
- 113 Converseville Rd
- 64 Old Ashburnham Rd
- 19 Monomonac Terrace
- 16 2nd St
- 35 Hillside Dr
- 7 Emerson Dr
- 40 Maple Dr
- Lot 1 Saybrook Dr
- Lot 2 Saybrook Dr
- Lot 15-0 Saybrook Dr
- Lot 14 Saybrook Dr
- 11 Mark St
- 0 Monomonac Rd W
- 634 Old New Ipswich Rd
- 10 Sun Cliff Dr
- 714 Old New Ipswich Rd
- 703 Old New Ipswich Rd
- 20 W Main St
- 119 W Shore Dr