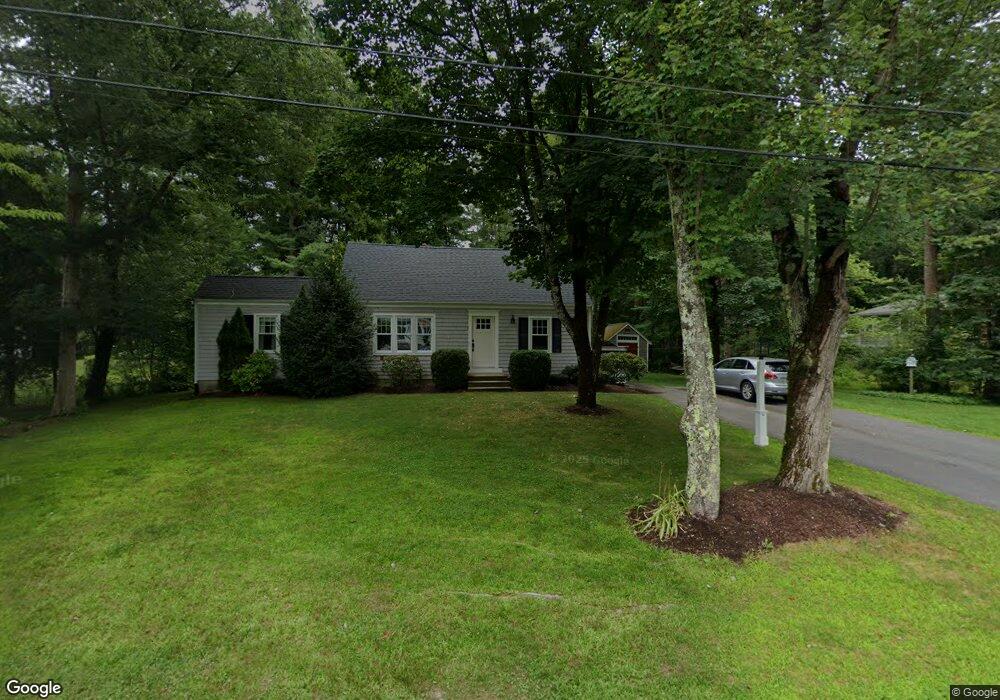
84 Tucker Rd Hanover, MA 02339
Estimated Value: $622,687 - $706,000
3
Beds
2
Baths
1,485
Sq Ft
$436/Sq Ft
Est. Value
About This Home
This home is located at 84 Tucker Rd, Hanover, MA 02339 and is currently estimated at $647,672, approximately $436 per square foot. 84 Tucker Rd is a home located in Plymouth County with nearby schools including Hanover High School, Cadence Academy Preschool - Hanover, and The Master's Academy.
Ownership History
Date
Name
Owned For
Owner Type
Purchase Details
Closed on
Jun 4, 2004
Sold by
Dyer Andrew J
Bought by
Talbot Thomas C and Talbot Pamela
Current Estimated Value
Home Financials for this Owner
Home Financials are based on the most recent Mortgage that was taken out on this home.
Original Mortgage
$295,000
Interest Rate
5.94%
Mortgage Type
Purchase Money Mortgage
Purchase Details
Closed on
Dec 18, 2003
Sold by
Kuplast Nancy J and Barclay Florence L
Bought by
Dyer Andrew J
Home Financials for this Owner
Home Financials are based on the most recent Mortgage that was taken out on this home.
Original Mortgage
$220,500
Interest Rate
5.96%
Mortgage Type
Purchase Money Mortgage
Create a Home Valuation Report for This Property
The Home Valuation Report is an in-depth analysis detailing your home's value as well as a comparison with similar homes in the area
Home Values in the Area
Average Home Value in this Area
Purchase History
| Date | Buyer | Sale Price | Title Company |
|---|---|---|---|
| Talbot Thomas C | $414,000 | -- | |
| Dyer Andrew J | $245,000 | -- |
Source: Public Records
Mortgage History
| Date | Status | Borrower | Loan Amount |
|---|---|---|---|
| Open | Dyer Andrew J | $261,000 | |
| Closed | Dyer Andrew J | $278,000 | |
| Closed | Dyer Andrew J | $295,000 | |
| Previous Owner | Dyer Andrew J | $220,500 |
Source: Public Records
Tax History
| Year | Tax Paid | Tax Assessment Tax Assessment Total Assessment is a certain percentage of the fair market value that is determined by local assessors to be the total taxable value of land and additions on the property. | Land | Improvement |
|---|---|---|---|---|
| 2025 | $6,455 | $522,700 | $263,200 | $259,500 |
| 2024 | $6,342 | $493,900 | $263,200 | $230,700 |
| 2023 | $6,115 | $453,300 | $239,400 | $213,900 |
| 2022 | $6,167 | $404,400 | $239,400 | $165,000 |
| 2021 | $6,195 | $376,700 | $217,600 | $159,100 |
| 2020 | $8,191 | $374,000 | $217,600 | $156,400 |
| 2019 | $9,913 | $353,100 | $217,600 | $135,500 |
| 2018 | $5,703 | $350,300 | $217,600 | $132,700 |
| 2017 | $5,152 | $312,200 | $198,200 | $114,000 |
| 2016 | $5,006 | $296,900 | $180,200 | $116,700 |
| 2015 | $4,708 | $291,500 | $180,200 | $111,300 |
Source: Public Records
Map
Nearby Homes
- 506 Main St
- 62 Larchmont Ln
- 168 Larchmont Ln
- 776 Main St
- 44 Stone Meadow Ln
- 47 Stone Meadow Ln
- 36 Grove St
- 250 Center St
- 36 Bayberry Ln
- 51 Cervelli Farm Dr
- 37 Dr
- 23 Cervelli Farm Dr
- 38 Cervelli Farm Dr
- 9 Cervelli Farm Dr
- 53 Chestnut St
- 75 School St
- 535 Webster St
- 127 King St
- 95 Tecumseh Dr
- 823 Market St
Your Personal Tour Guide
Ask me questions while you tour the home.