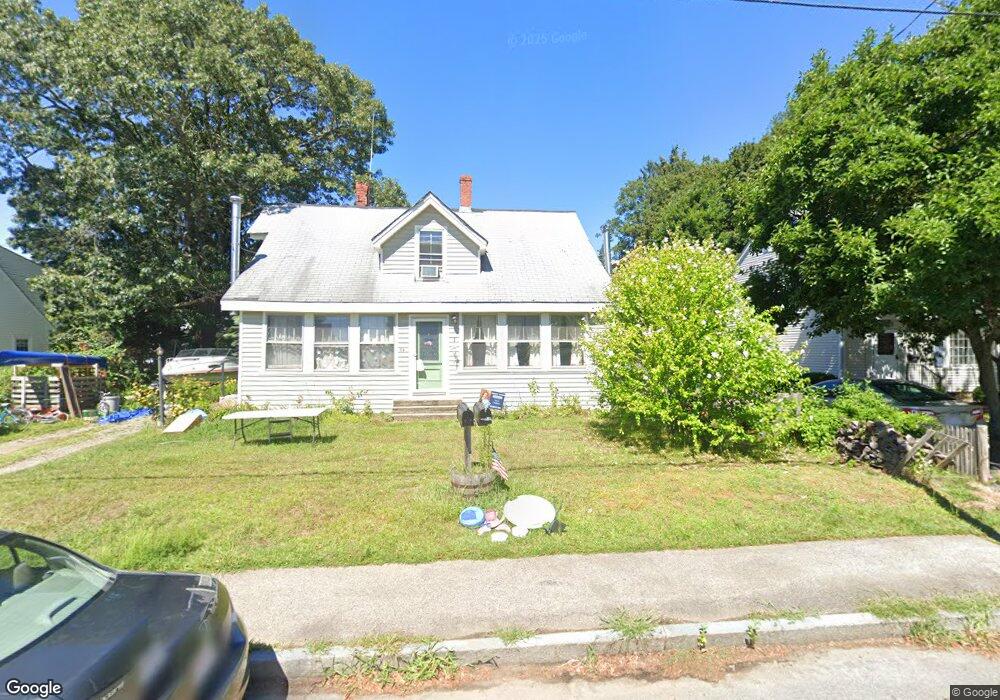
84 Union St South Hamilton, MA 01982
Estimated Value: $713,000 - $930,000
4
Beds
2
Baths
1,458
Sq Ft
$568/Sq Ft
Est. Value
About This Home
This home is located at 84 Union St, South Hamilton, MA 01982 and is currently estimated at $828,420, approximately $568 per square foot. 84 Union St is a home located in Essex County with nearby schools including Winthrop School, Cutler Elementary School, and Bessie Buker Elementary School.
Ownership History
Date
Name
Owned For
Owner Type
Purchase Details
Closed on
Mar 5, 2019
Sold by
Weagle Elizabeth M
Bought by
Dubois Amy J and Dubois David P
Current Estimated Value
Purchase Details
Closed on
Sep 28, 2010
Sold by
Weagle Susan F
Bought by
Dubois David P and Dubois Amy J
Home Financials for this Owner
Home Financials are based on the most recent Mortgage that was taken out on this home.
Original Mortgage
$74,500
Interest Rate
4.48%
Mortgage Type
Purchase Money Mortgage
Create a Home Valuation Report for This Property
The Home Valuation Report is an in-depth analysis detailing your home's value as well as a comparison with similar homes in the area
Home Values in the Area
Average Home Value in this Area
Purchase History
| Date | Buyer | Sale Price | Title Company |
|---|---|---|---|
| Dubois Amy J | -- | -- | |
| Dubois David P | $350,000 | -- |
Source: Public Records
Mortgage History
| Date | Status | Borrower | Loan Amount |
|---|---|---|---|
| Previous Owner | Dubois David P | $74,500 | |
| Previous Owner | Dubois David P | $25,000 |
Source: Public Records
Tax History Compared to Growth
Tax History
| Year | Tax Paid | Tax Assessment Tax Assessment Total Assessment is a certain percentage of the fair market value that is determined by local assessors to be the total taxable value of land and additions on the property. | Land | Improvement |
|---|---|---|---|---|
| 2025 | $9,598 | $613,300 | $270,800 | $342,500 |
| 2024 | $9,101 | $602,300 | $270,800 | $331,500 |
| 2023 | $8,966 | $548,700 | $260,200 | $288,500 |
| 2022 | $8,802 | $492,300 | $234,900 | $257,400 |
| 2021 | $8,091 | $462,100 | $234,900 | $227,200 |
| 2020 | $7,614 | $448,400 | $233,000 | $215,400 |
| 2019 | $7,246 | $439,700 | $226,200 | $213,500 |
| 2018 | $6,670 | $411,200 | $213,500 | $197,700 |
| 2017 | $6,358 | $378,200 | $199,600 | $178,600 |
| 2016 | $6,063 | $351,500 | $183,000 | $168,500 |
| 2015 | $5,747 | $336,300 | $174,300 | $162,000 |
| 2014 | $5,709 | $328,100 | $178,100 | $150,000 |
Source: Public Records
Map
Nearby Homes