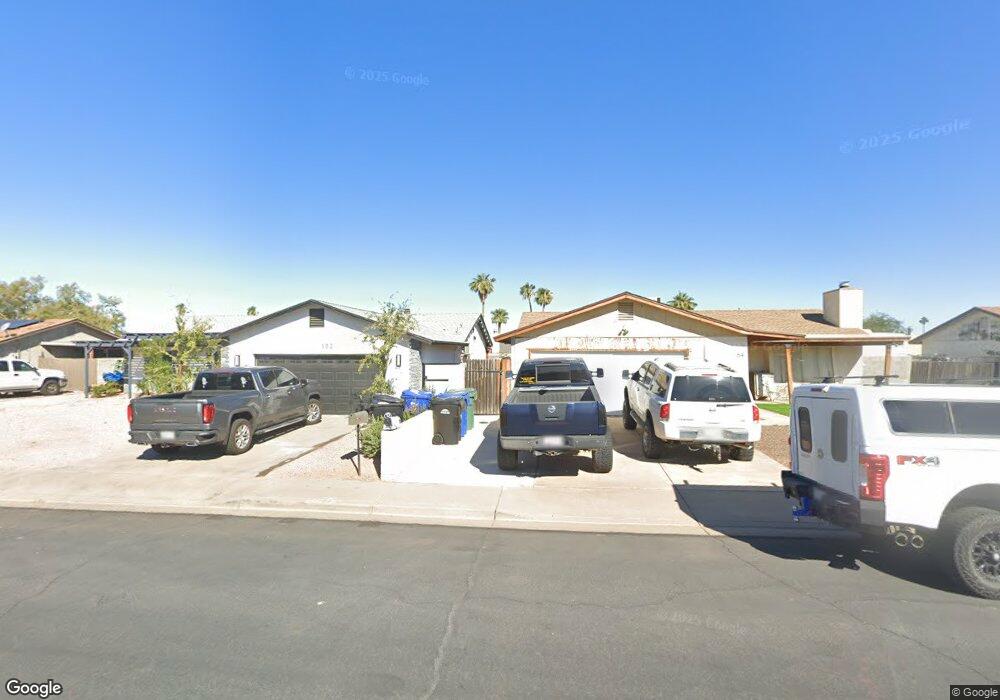
84 W Hillview St Mesa, AZ 85201
North Central Mesa NeighborhoodEstimated Value: $398,000 - $435,000
--
Bed
2
Baths
1,228
Sq Ft
$336/Sq Ft
Est. Value
About This Home
This home is located at 84 W Hillview St, Mesa, AZ 85201 and is currently estimated at $412,366, approximately $335 per square foot. 84 W Hillview St is a home located in Maricopa County with nearby schools including Edison Elementary School, Franklin at Brimhall Elementary School, and Franklin West Elementary School.
Ownership History
Date
Name
Owned For
Owner Type
Purchase Details
Closed on
Nov 9, 2017
Sold by
2017 2 Ih Borrower Lp
Bought by
2017 2 Ih Borrower Lp
Current Estimated Value
Home Financials for this Owner
Home Financials are based on the most recent Mortgage that was taken out on this home.
Original Mortgage
$865,027,000
Outstanding Balance
$724,468,013
Interest Rate
3.83%
Mortgage Type
Construction
Estimated Equity
-$724,055,647
Purchase Details
Closed on
Mar 8, 2013
Sold by
Dopudja Dan
Bought by
Thr Phoenix Lp
Purchase Details
Closed on
Mar 2, 1995
Sold by
Lupo Santo A and Lupo Renee A
Bought by
Dopudja Dan and Dopudja Marybeth
Home Financials for this Owner
Home Financials are based on the most recent Mortgage that was taken out on this home.
Original Mortgage
$89,571
Interest Rate
8.81%
Mortgage Type
FHA
Create a Home Valuation Report for This Property
The Home Valuation Report is an in-depth analysis detailing your home's value as well as a comparison with similar homes in the area
Home Values in the Area
Average Home Value in this Area
Purchase History
| Date | Buyer | Sale Price | Title Company |
|---|---|---|---|
| 2017 2 Ih Borrower Lp | -- | None Available | |
| Thr Phoenix Lp | $145,000 | Lawyers Title Of Arizona Inc | |
| Dopudja Dan | $90,000 | Fidelity Title |
Source: Public Records
Mortgage History
| Date | Status | Borrower | Loan Amount |
|---|---|---|---|
| Open | 2017 2 Ih Borrower Lp | $865,027,000 | |
| Previous Owner | Dopudja Dan | $89,571 |
Source: Public Records
Tax History Compared to Growth
Tax History
| Year | Tax Paid | Tax Assessment Tax Assessment Total Assessment is a certain percentage of the fair market value that is determined by local assessors to be the total taxable value of land and additions on the property. | Land | Improvement |
|---|---|---|---|---|
| 2025 | $1,481 | $15,014 | -- | -- |
| 2024 | $1,486 | $14,299 | -- | -- |
| 2023 | $1,486 | $28,150 | $5,630 | $22,520 |
| 2022 | $1,455 | $21,500 | $4,300 | $17,200 |
| 2021 | $1,473 | $19,680 | $3,930 | $15,750 |
| 2020 | $1,454 | $18,160 | $3,630 | $14,530 |
| 2019 | $1,358 | $16,930 | $3,380 | $13,550 |
| 2018 | $1,304 | $14,970 | $2,990 | $11,980 |
| 2017 | $1,265 | $14,230 | $2,840 | $11,390 |
| 2016 | $1,241 | $13,560 | $2,710 | $10,850 |
| 2015 | $1,166 | $11,760 | $2,350 | $9,410 |
Source: Public Records
Map
Nearby Homes
- 709 E Halifax St
- 953 E Hackamore St
- 860 E Brown Rd Unit 25-28
- 1663 N Nevada Way
- 1150 N Wedgewood Cir
- 1139 E Huber St
- 465 E Halifax St
- 1138 N Dresden Cir
- 1550 N Stapley Dr Unit 6
- 1550 N Stapley Dr Unit 48
- 1305 N Spring Cir
- 1204 E Glencove Cir
- 1341 N Pomeroy
- 630 E Jensen St Unit 189
- 630 E Jensen St Unit 148
- 630 E Jensen St Unit 106
- 1232 E Mclellan Rd
- 347 E Hope St
- 1314 E Greenway Cir
- 1759 N Spring Cir
- 811 E Hillview Cir
- 803 E Hillview Cir
- 808 E Hillview Cir
- 819 E Hillview Cir
- 810 E Halifax St
- 818 E Halifax St Unit 1E
- 802 E Halifax St
- 829 E Hillview Cir
- 812 E Hillview Cir
- 804 E Hillview Cir
- 828 E Halifax St
- 820 E Hillview Cir
- 767 E Hillview St
- 1418 N Freestone Cir
- 1410 N Freestone Cir
- 809 E Halifax St
- 766 E Halifax St
- 817 E Halifax St
- 815 E Hope St
- 801 E Halifax St