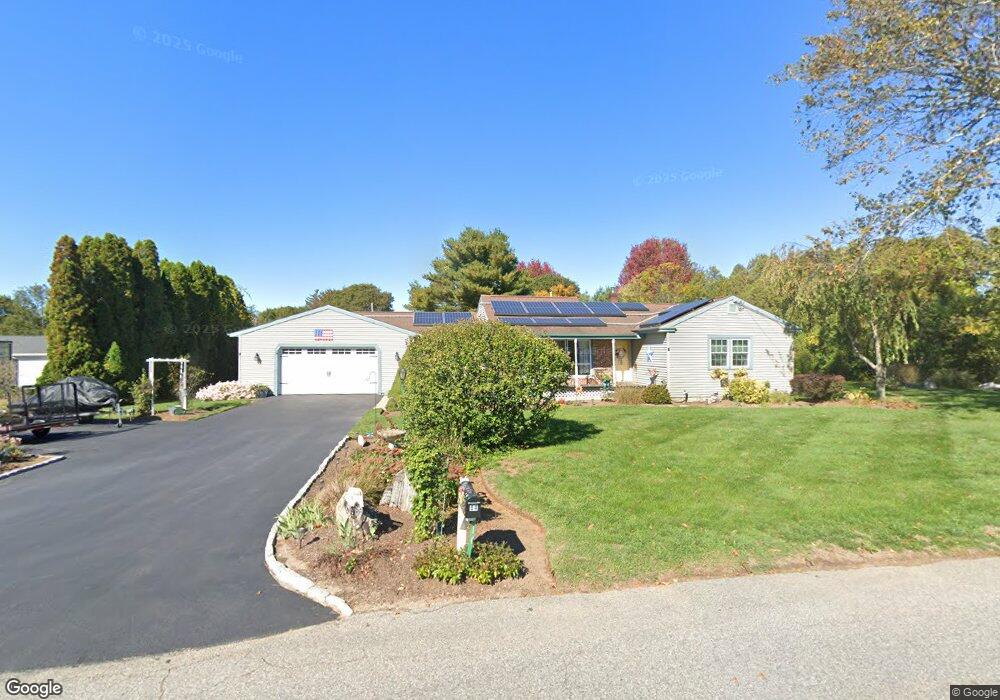
84 Wood St Rehoboth, MA 02769
Estimated Value: $472,000 - $591,000
3
Beds
2
Baths
1,638
Sq Ft
$337/Sq Ft
Est. Value
About This Home
This home is located at 84 Wood St, Rehoboth, MA 02769 and is currently estimated at $552,636, approximately $337 per square foot. 84 Wood St is a home located in Bristol County with nearby schools including Dighton-Rehoboth Regional High School.
Ownership History
Date
Name
Owned For
Owner Type
Purchase Details
Closed on
Dec 10, 2007
Sold by
Terra George C and Terra Helen J
Bought by
Terra George C and Terra Helen J
Current Estimated Value
Home Financials for this Owner
Home Financials are based on the most recent Mortgage that was taken out on this home.
Original Mortgage
$270,000
Outstanding Balance
$171,516
Interest Rate
6.37%
Mortgage Type
Purchase Money Mortgage
Estimated Equity
$381,120
Create a Home Valuation Report for This Property
The Home Valuation Report is an in-depth analysis detailing your home's value as well as a comparison with similar homes in the area
Home Values in the Area
Average Home Value in this Area
Purchase History
| Date | Buyer | Sale Price | Title Company |
|---|---|---|---|
| Terra George C | -- | -- |
Source: Public Records
Mortgage History
| Date | Status | Borrower | Loan Amount |
|---|---|---|---|
| Open | Terra George C | $270,000 |
Source: Public Records
Tax History Compared to Growth
Tax History
| Year | Tax Paid | Tax Assessment Tax Assessment Total Assessment is a certain percentage of the fair market value that is determined by local assessors to be the total taxable value of land and additions on the property. | Land | Improvement |
|---|---|---|---|---|
| 2025 | $51 | $461,800 | $157,200 | $304,600 |
| 2024 | $4,343 | $382,300 | $157,200 | $225,100 |
| 2023 | $4,226 | $364,900 | $154,200 | $210,700 |
| 2022 | $4,167 | $328,900 | $154,200 | $174,700 |
| 2021 | $4,099 | $309,600 | $146,700 | $162,900 |
| 2020 | $3,890 | $296,500 | $146,700 | $149,800 |
| 2018 | $3,422 | $285,900 | $139,800 | $146,100 |
| 2017 | $3,168 | $252,200 | $139,800 | $112,400 |
| 2016 | $3,109 | $255,900 | $139,800 | $116,100 |
| 2015 | $2,885 | $234,400 | $133,200 | $101,200 |
| 2014 | $2,838 | $228,100 | $126,900 | $101,200 |
Source: Public Records
Map
Nearby Homes
- 32 Providence St
- 198 Brook St
- 203 Providence St Bldr Lot 5
- 127 Mason St
- 205 Providence St Bldr Lot 3
- 267 Chestnut St
- 17 Sassafras Rd
- 36 Columbine Rd
- 0 Winter St
- 1 Cedarbrook Unit A
- 92 Martin St
- 10 Quaker Ln
- 129 Cameron Way
- 3a Johnnies Way
- 3b Johnnies Way
- 42 Linden Ln
- 3 Johnnies Way
- 75 Martin St
- 7 Johnnies Way
- 120 Plain St