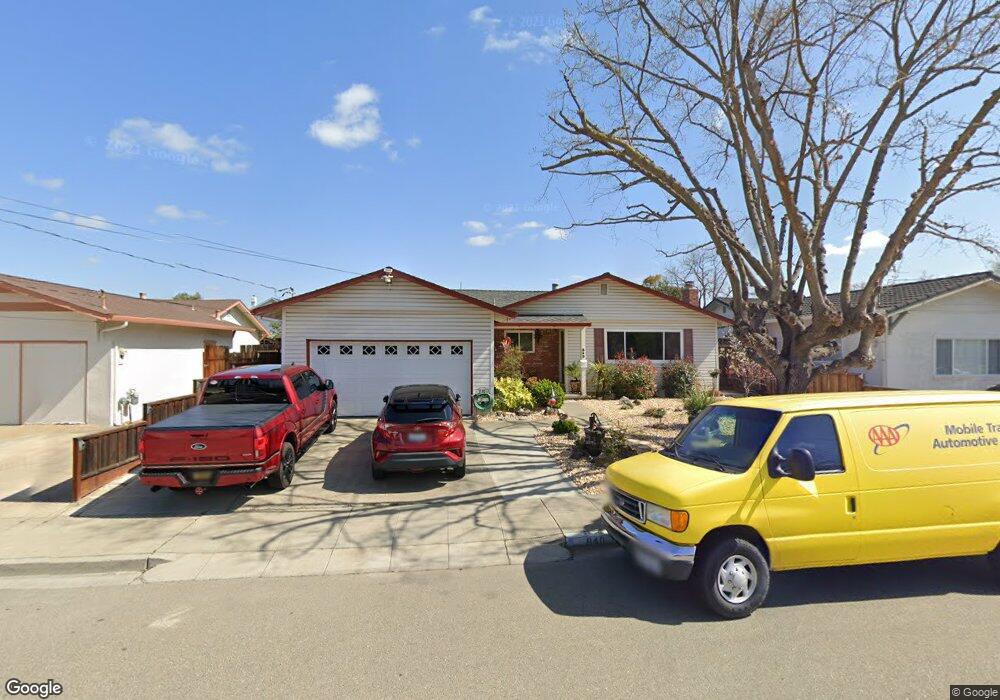
840 Brennan Way Livermore, CA 94550
Estimated Value: $979,000 - $1,213,000
4
Beds
2
Baths
1,647
Sq Ft
$668/Sq Ft
Est. Value
About This Home
This home is located at 840 Brennan Way, Livermore, CA 94550 and is currently estimated at $1,099,687, approximately $667 per square foot. 840 Brennan Way is a home located in Alameda County with nearby schools including Jackson Avenue Elementary School, East Avenue Middle School, and Livermore High School.
Ownership History
Date
Name
Owned For
Owner Type
Purchase Details
Closed on
Oct 16, 2023
Sold by
Schiller Joseph L and Schiller Kateri G
Bought by
Schiller Family Living Trust and Schiller
Current Estimated Value
Purchase Details
Closed on
Dec 17, 1997
Sold by
Washington Mutual Bank Fa
Bought by
Schiller Joseph L and Schiller Kateri G
Home Financials for this Owner
Home Financials are based on the most recent Mortgage that was taken out on this home.
Original Mortgage
$149,600
Interest Rate
7.23%
Purchase Details
Closed on
Oct 3, 1997
Sold by
Enos Robert R and Enos Kelly A
Bought by
Great Western Bank
Purchase Details
Closed on
Dec 10, 1996
Sold by
Enos Robert R
Bought by
Enos Kelly A
Create a Home Valuation Report for This Property
The Home Valuation Report is an in-depth analysis detailing your home's value as well as a comparison with similar homes in the area
Home Values in the Area
Average Home Value in this Area
Purchase History
| Date | Buyer | Sale Price | Title Company |
|---|---|---|---|
| Schiller Family Living Trust | -- | None Listed On Document | |
| Schiller Joseph L | -- | None Listed On Document | |
| Schiller Joseph L | $187,000 | Chicago Title Co | |
| Great Western Bank | $48,965 | Chicago Title Co | |
| Enos Kelly A | -- | -- |
Source: Public Records
Mortgage History
| Date | Status | Borrower | Loan Amount |
|---|---|---|---|
| Previous Owner | Schiller Joseph L | $149,600 | |
| Closed | Schiller Joseph L | $18,700 |
Source: Public Records
Tax History Compared to Growth
Tax History
| Year | Tax Paid | Tax Assessment Tax Assessment Total Assessment is a certain percentage of the fair market value that is determined by local assessors to be the total taxable value of land and additions on the property. | Land | Improvement |
|---|---|---|---|---|
| 2025 | $4,470 | $298,577 | $89,573 | $209,004 |
| 2024 | $4,470 | $292,723 | $87,817 | $204,906 |
| 2023 | $4,389 | $286,984 | $86,095 | $200,889 |
| 2022 | $4,311 | $281,357 | $84,407 | $196,950 |
| 2021 | $3,471 | $275,841 | $82,752 | $193,089 |
| 2020 | $4,079 | $273,014 | $81,904 | $191,110 |
| 2019 | $4,084 | $267,661 | $80,298 | $187,363 |
| 2018 | $3,983 | $262,414 | $78,724 | $183,690 |
| 2017 | $3,871 | $257,270 | $77,181 | $180,089 |
| 2016 | $3,712 | $252,227 | $75,668 | $176,559 |
| 2015 | $3,492 | $248,438 | $74,531 | $173,907 |
| 2014 | $3,428 | $243,572 | $73,071 | $170,501 |
Source: Public Records
Map
Nearby Homes
- 3283 East Ave
- 3732 Carrigan Common
- 1153 Sherry Way
- 2878 4th St Unit 1401
- 3491 Madeira Way
- 2211 College Ave
- 2908 Worthing Common
- 1324 Chateau Common Unit 206
- 3877 Santa Clara Way
- 3370 Gardella Plaza
- 3959 Purdue Way
- 3713 First St
- 1909 De Vaca Way
- 161 N L St Unit 101
- 1948 Railroad Ave Unit 104
- 1810 Peary Way
- 1004 Vienna St
- 1727 2nd St
- 2602 Lucca Ct
- 1623 4th St
- 848 Brennan Way
- 832 Brennan Way
- 845 Arbor Ct
- 856 Brennan Way
- 853 Arbor Ct
- 816 Brennan Way
- 3029 Arbor Ave
- 843 Brennan Way
- 829 Arbor Ct
- 835 Brennan Way
- 864 Brennan Way
- 861 Arbor Ct
- 827 Brennan Way
- 859 Brennan Way
- 821 Arbor Ct
- 819 Brennan Way
- 894 Brennan Way Unit 28
- 790 Mcleod St
- 2926 Cabrillo Ave
- 2948 Cabrillo Ave