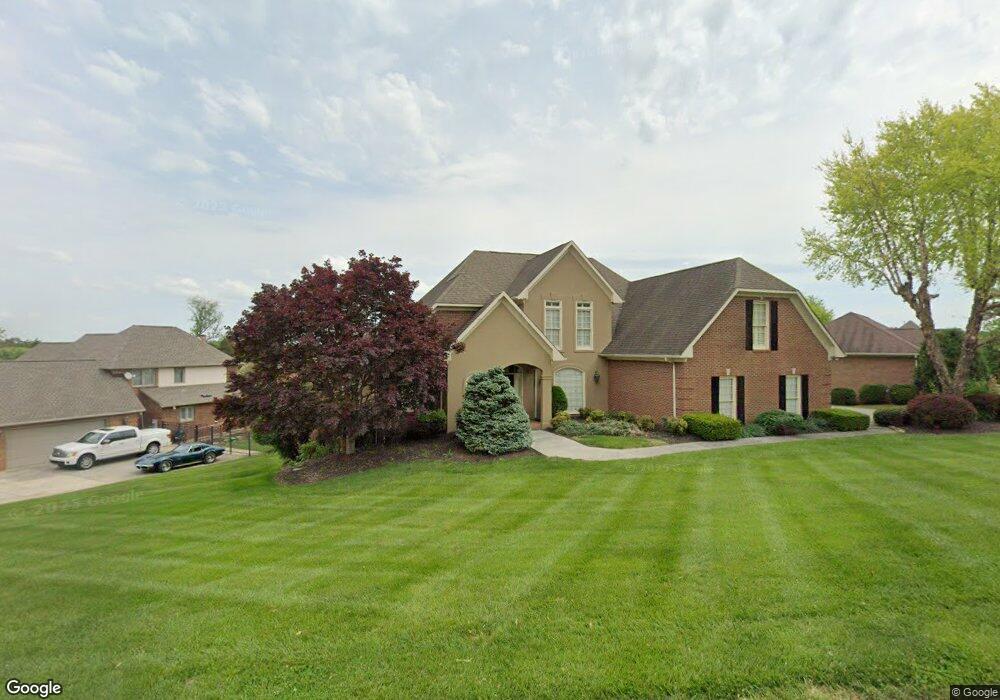
840 Colonial Dr Morristown, TN 37814
Estimated Value: $517,443 - $643,000
--
Bed
3
Baths
3,521
Sq Ft
$165/Sq Ft
Est. Value
About This Home
This home is located at 840 Colonial Dr, Morristown, TN 37814 and is currently estimated at $582,111, approximately $165 per square foot. 840 Colonial Dr is a home located in Hamblen County with nearby schools including Manley Elementary School, West View Middle School, and Morristown West High School.
Ownership History
Date
Name
Owned For
Owner Type
Purchase Details
Closed on
Apr 13, 2020
Sold by
Kinsler Regina S
Bought by
Kinsler Jeffrey S
Current Estimated Value
Purchase Details
Closed on
Jul 14, 2008
Sold by
Henrikson Steven R
Bought by
Kinsler Jeffery S
Home Financials for this Owner
Home Financials are based on the most recent Mortgage that was taken out on this home.
Original Mortgage
$156,000
Outstanding Balance
$101,656
Interest Rate
6.27%
Estimated Equity
$480,455
Purchase Details
Closed on
Feb 1, 1993
Bought by
Henrikson Steven R and Henrikson Nancy B
Purchase Details
Closed on
Aug 27, 1992
Bought by
Henrikson Steven R and Henrikson Nancy B
Purchase Details
Closed on
Jun 6, 1990
Bought by
Skelton Wayman
Purchase Details
Closed on
May 30, 1990
Bought by
Skelton Wayman
Purchase Details
Closed on
Dec 21, 1988
Bought by
Jenkins Skelton Reneau & Assoc
Purchase Details
Closed on
Jan 2, 1985
Bought by
Colonial Standard Ventures Inc
Create a Home Valuation Report for This Property
The Home Valuation Report is an in-depth analysis detailing your home's value as well as a comparison with similar homes in the area
Home Values in the Area
Average Home Value in this Area
Purchase History
| Date | Buyer | Sale Price | Title Company |
|---|---|---|---|
| Kinsler Jeffrey S | -- | None Available | |
| Kinsler Jeffery S | $356,000 | -- | |
| Henrikson Steven R | -- | -- | |
| Henrikson Steven R | $192,500 | -- | |
| Skelton Wayman | -- | -- | |
| Skelton Wayman | -- | -- | |
| Jenkins Skelton Reneau & Assoc | $675,000 | -- | |
| Colonial Standard Ventures Inc | -- | -- |
Source: Public Records
Mortgage History
| Date | Status | Borrower | Loan Amount |
|---|---|---|---|
| Open | Colonial Standard Ventures Inc | $156,000 |
Source: Public Records
Tax History Compared to Growth
Tax History
| Year | Tax Paid | Tax Assessment Tax Assessment Total Assessment is a certain percentage of the fair market value that is determined by local assessors to be the total taxable value of land and additions on the property. | Land | Improvement |
|---|---|---|---|---|
| 2024 | $1,734 | $98,525 | $10,900 | $87,625 |
| 2023 | $1,734 | $98,525 | $0 | $0 |
| 2022 | $3,113 | $98,525 | $10,900 | $87,625 |
| 2021 | $3,113 | $98,525 | $10,900 | $87,625 |
| 2020 | $3,109 | $98,525 | $10,900 | $87,625 |
| 2019 | $3,035 | $89,275 | $11,700 | $77,575 |
| 2018 | $2,812 | $89,275 | $11,700 | $77,575 |
| 2017 | $2,767 | $89,275 | $11,700 | $77,575 |
| 2016 | $2,642 | $89,275 | $11,700 | $77,575 |
| 2015 | $2,459 | $89,275 | $11,700 | $77,575 |
| 2014 | -- | $89,275 | $11,700 | $77,575 |
| 2013 | -- | $96,750 | $0 | $0 |
Source: Public Records
Map
Nearby Homes
- 801 Colonial Dr
- 700 Drinnon Dr
- 2978 Wilshire Blvd
- 1054 Colonial Dr
- 3471 Walden Dr
- 3475 Walden Dr
- 1086 St Ives Ct
- 400 Drinnon Dr
- 3542 Wedgewood Dr
- 725 Barton Dr
- 490 E Sunset Hills
- 3641 Meadowland Dr
- 2444 Sandstone Dr
- 2454 Sandstone Dr
- 2430 Sandstone Dr
- 2310 Sandstone Dr
- 837 Foxglove Ln
- 1736 Jellicorse Rd
- 985 Kidwell Ridge Rd
- 2045 N Economy Rd Unit A3
- 832 Colonial Dr
- 848 Colonial Dr
- 3072 Federal Blvd
- 841 Colonial Dr
- 833 Colonial Dr
- 857 Colonial Dr
- 824 Colonial Dr
- 849 Colonial Dr
- 825 Colonial Dr
- 3080 Federal Blvd
- 3048 Brandywine Cir
- 900 Colonial Dr
- 816 Colonial Dr
- 900 Drinnon Dr
- 817 Colonial Dr
- 904 Drinnon Dr
- 901 Colonial Dr
- 3088 Federal Blvd
- 818 Drinnon Dr
- 3040 Brandywine Cir