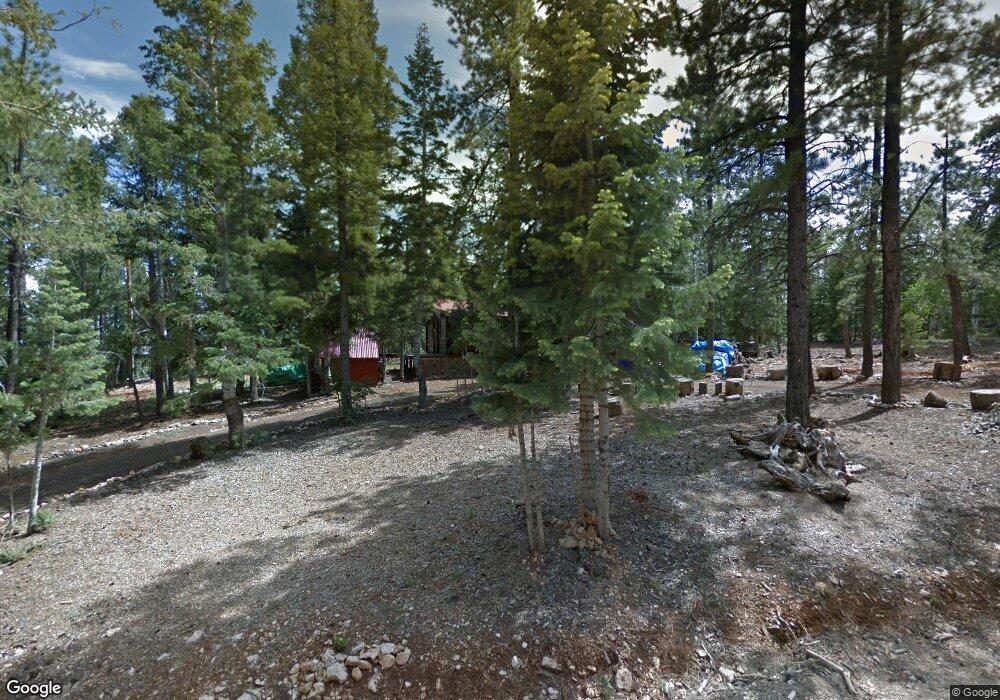
840 E Whispering Pines Dr Kanab, UT 84741
Duck Creek Village NeighborhoodEstimated Value: $356,000 - $449,000
Studio
--
Bath
804
Sq Ft
$501/Sq Ft
Est. Value
About This Home
This home is located at 840 E Whispering Pines Dr, Kanab, UT 84741 and is currently estimated at $402,500, approximately $500 per square foot. 840 E Whispering Pines Dr is a home with nearby schools including Valley Elementary School and Valley High School.
Ownership History
Date
Name
Owned For
Owner Type
Purchase Details
Closed on
Dec 12, 2018
Sold by
Bruley Larry A
Bought by
Petrocelli Nannette M
Current Estimated Value
Purchase Details
Closed on
Aug 15, 2012
Sold by
Michigan Commerce Bank
Bought by
Zavatsky James A
Home Financials for this Owner
Home Financials are based on the most recent Mortgage that was taken out on this home.
Original Mortgage
$97,000
Interest Rate
3.56%
Purchase Details
Closed on
Nov 24, 2010
Sold by
Witcher Melissa Jane and Witcher Melissa J
Bought by
Michigan Commerce Bank and Supplemental Care Trust Fbo Witcher Mega
Purchase Details
Closed on
Jun 1, 2010
Sold by
Wells Fargo Bank Na
Bought by
Etitle Insurance Agency
Purchase Details
Closed on
May 11, 2010
Sold by
Wells Fargo Bank Na
Bought by
Etitle Insurance Agency
Purchase Details
Closed on
Apr 2, 2009
Sold by
Belford Brian C
Bought by
Witcher Melissa J
Purchase Details
Closed on
Dec 7, 2006
Sold by
Witcher Melissa J
Bought by
Belford Brian C
Create a Home Valuation Report for This Property
The Home Valuation Report is an in-depth analysis detailing your home's value as well as a comparison with similar homes in the area
Home Values in the Area
Average Home Value in this Area
Purchase History
| Date | Buyer | Sale Price | Title Company |
|---|---|---|---|
| Petrocelli Nannette M | -- | -- | |
| Zavatsky James A | -- | -- | |
| Michigan Commerce Bank | -- | -- | |
| Etitle Insurance Agency | -- | -- | |
| Etitle Insurance Agency | -- | -- | |
| Witcher Melissa J | -- | -- | |
| Belford Brian C | -- | -- |
Source: Public Records
Mortgage History
| Date | Status | Borrower | Loan Amount |
|---|---|---|---|
| Previous Owner | Zavatsky James A | $97,000 |
Source: Public Records
Tax History
| Year | Tax Paid | Tax Assessment Tax Assessment Total Assessment is a certain percentage of the fair market value that is determined by local assessors to be the total taxable value of land and additions on the property. | Land | Improvement |
|---|---|---|---|---|
| 2025 | $950 | $251,117 | $118,776 | $132,341 |
| 2024 | $956 | $137,784 | $60,488 | $77,296 |
| 2023 | $864 | $132,285 | $54,989 | $77,296 |
| 2022 | $985 | $133,358 | $56,403 | $76,955 |
| 2021 | $1,388 | $155,310 | $54,285 | $101,025 |
| 2020 | $1,275 | $137,669 | $49,350 | $88,319 |
| 2019 | $1,235 | $129,666 | $49,350 | $80,316 |
| 2018 | $1,146 | $119,262 | $49,350 | $69,912 |
| 2017 | $1,050 | $104,587 | $44,480 | $60,107 |
| 2016 | $1,079 | $104,587 | $44,480 | $60,107 |
| 2015 | $1,009 | $104,587 | $44,480 | $60,107 |
| 2014 | $1,009 | $97,557 | $44,480 | $53,077 |
| 2013 | -- | $90,516 | $0 | $0 |
Source: Public Records
Map
Nearby Homes
- 880 E Ridge Dr
- 870 Appaloosa Dr
- 4285 N Meadow Ranch Dr
- 790 E Cedar Mountain Dr
- 4310 N Cedar Mountain Dr
- 670 Church Dr
- 4370 N Meadow Ranch Dr
- 4350 N Meadow Ranch Dr
- 4145 Robbers Roost Rd
- 695 Movie Ranch Rd Unit DCP 11
- 4125 Robbers Roost Rd
- 350 Forest Dr
- 1015 E Pioneer Rd
- 4030 Doc Holliday Ln
- 390 Quaking Aspen Dr
- 4010 Porcupine Dr
- 295 Porcupine Dr
- 270 Whispering Pines Dr
- 1415 Mirror Dr
- 4051 Porcupine Cir
- 830 E Whispering Pines Dr
- 850 Whispering Pines Dr
- 4155 N N Pine Ridge Dr
- 4135 E E Pine Ridge Dr
- 835 E Whispering Pines Dr
- 4193 N N Pine Ridge Dr
- 825 E Whispering Pines Dr
- 4180 N N Pine Ridge Dr
- 4146 N N Pine Ridge Dr
- 4130 N N Pine Ridge Dr
- 4140 N N Pine Ridge Dr
- 4140 Pine Ridge Dr
- 4176 N N Pine Ridge Dr
- 4168 N N Pine Ridge Dr
- 4154 N N Pine Ridge Dr
- 805 E Whispering Pines Dr
- 4120 N N Pine Ridge Dr
- 790 E Whispering Pines Dr
- 840 E Forest Service Rd
- 795 E Whispering Pines Dr
Your Personal Tour Guide
Ask me questions while you tour the home.