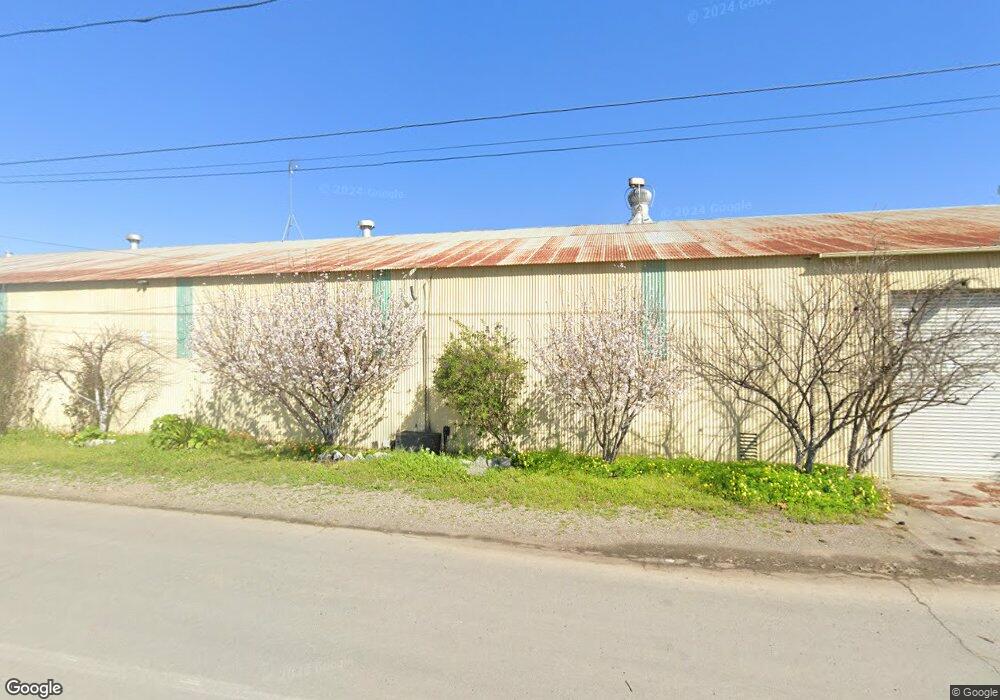
840 H St Los Banos, CA 93635
Studio
--
Bath
35,800
Sq Ft
35,806
Sq Ft Lot
About This Home
This home is located at 840 H St, Los Banos, CA 93635. 840 H St is a home located in Merced County with nearby schools including Los Banos Elementary School, Creekside Junior High School, and Los Banos High School.
Ownership History
Date
Name
Owned For
Owner Type
Purchase Details
Closed on
Aug 13, 2015
Sold by
Tsang Albert and Simone Richard
Bought by
Reyes Samuel
Home Financials for this Owner
Home Financials are based on the most recent Mortgage that was taken out on this home.
Original Mortgage
$281,477
Interest Rate
3.97%
Mortgage Type
Seller Take Back
Purchase Details
Closed on
Aug 7, 2015
Sold by
Pensco Trust Company
Bought by
Tseng Albert C and Tseng Elaine F
Home Financials for this Owner
Home Financials are based on the most recent Mortgage that was taken out on this home.
Original Mortgage
$281,477
Interest Rate
3.97%
Mortgage Type
Seller Take Back
Purchase Details
Closed on
May 16, 2011
Sold by
Ellingwood Sylvia
Bought by
Tsang Albert C and Tsang Elaine F
Purchase Details
Closed on
Jun 24, 2009
Sold by
Farsad Ali and Farsad Tooba
Bought by
Ellingwood Sylvia
Create a Home Valuation Report for This Property
The Home Valuation Report is an in-depth analysis detailing your home's value as well as a comparison with similar homes in the area
Home Values in the Area
Average Home Value in this Area
Purchase History
| Date | Buyer | Sale Price | Title Company |
|---|---|---|---|
| Reyes Samuel | $330,000 | Fidelity National Title Co | |
| Tseng Albert C | $25,000 | Fidelity National Title Co | |
| Tsang Albert C | $50,000 | None Available | |
| Ellingwood Sylvia | $150,000 | Fatco |
Source: Public Records
Mortgage History
| Date | Status | Borrower | Loan Amount |
|---|---|---|---|
| Previous Owner | Reyes Samuel | $281,477 |
Source: Public Records
Tax History
| Year | Tax Paid | Tax Assessment Tax Assessment Total Assessment is a certain percentage of the fair market value that is determined by local assessors to be the total taxable value of land and additions on the property. | Land | Improvement |
|---|---|---|---|---|
| 2025 | $11,556 | $356,040 | $307,783 | $48,257 |
| 2024 | $11,556 | $349,060 | $301,749 | $47,311 |
| 2023 | $10,013 | $342,217 | $295,833 | $46,384 |
| 2022 | $9,960 | $335,508 | $290,033 | $45,475 |
| 2021 | $9,350 | $328,931 | $284,347 | $44,584 |
| 2020 | $9,042 | $325,559 | $281,432 | $44,127 |
| 2019 | $8,825 | $319,176 | $275,914 | $43,262 |
| 2018 | $3,423 | $312,918 | $270,504 | $42,414 |
| 2017 | $3,318 | $300,900 | $265,200 | $35,700 |
| 2016 | $4,451 | $391,376 | $124,256 | $267,120 |
| 2015 | $4,038 | $357,109 | $127,919 | $229,190 |
| 2014 | $3,928 | $350,115 | $125,414 | $224,701 |
Source: Public Records
Map
Nearby Homes
- 820 J St
- 956 J St
- 631 I St
- 1032 9th St
- 1144 G St
- 422 J St
- 1043 Adams Ave
- 1062 Madison Ave
- 506 M St
- 1014 3rd St
- 2114 Coulter Ln Unit 393P
- 709 Madison Ave
- 0 W I St Unit ML81999689
- 1102 California Ave
- 1501 Sarba Ct
- 1505 Sarba Ct
- 0 W Pacheco Blvd Unit MC25270249
- 441 Lime Ave
- 17490 Mercey Springs Rd
- 214 N Santa Clara St
Your Personal Tour Guide
Ask me questions while you tour the home.