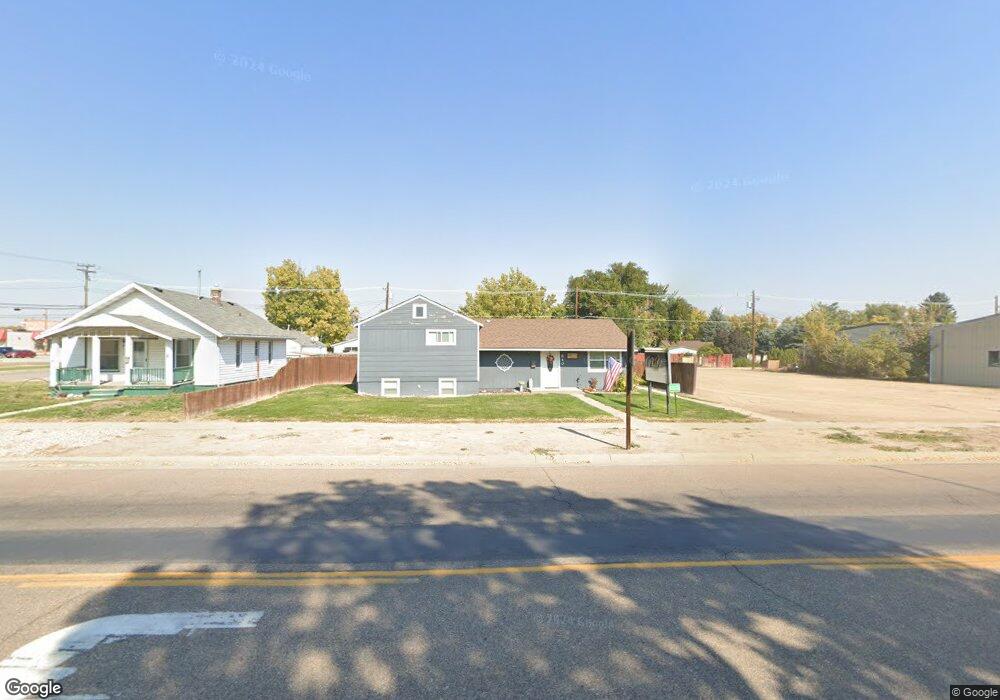
840 M St Unit 840/840 1/2 M St. Gering, NE 69341
Estimated Value: $174,000 - $248,000
3
Beds
3
Baths
1,124
Sq Ft
$184/Sq Ft
Est. Value
About This Home
This home is located at 840 M St Unit 840/840 1/2 M St., Gering, NE 69341 and is currently estimated at $207,312, approximately $184 per square foot. 840 M St Unit 840/840 1/2 M St. is a home located in Scotts Bluff County with nearby schools including Gering High School and Community Christian Elementary/Middle School.
Ownership History
Date
Name
Owned For
Owner Type
Purchase Details
Closed on
Oct 23, 2019
Sold by
Pederson Douglas L and Pederson Candice K
Bought by
Torres Christopher and Torres Cindy M
Current Estimated Value
Home Financials for this Owner
Home Financials are based on the most recent Mortgage that was taken out on this home.
Original Mortgage
$140,553
Outstanding Balance
$123,382
Interest Rate
3.6%
Mortgage Type
New Conventional
Estimated Equity
$83,930
Create a Home Valuation Report for This Property
The Home Valuation Report is an in-depth analysis detailing your home's value as well as a comparison with similar homes in the area
Home Values in the Area
Average Home Value in this Area
Purchase History
| Date | Buyer | Sale Price | Title Company |
|---|---|---|---|
| Torres Christopher | $145,000 | -- |
Source: Public Records
Mortgage History
| Date | Status | Borrower | Loan Amount |
|---|---|---|---|
| Open | Torres Christopher | $140,553 |
Source: Public Records
Tax History Compared to Growth
Tax History
| Year | Tax Paid | Tax Assessment Tax Assessment Total Assessment is a certain percentage of the fair market value that is determined by local assessors to be the total taxable value of land and additions on the property. | Land | Improvement |
|---|---|---|---|---|
| 2024 | $3,264 | $186,325 | $22,750 | $163,575 |
| 2023 | $2,962 | $138,184 | $5,250 | $132,934 |
| 2022 | $2,962 | $138,184 | $5,250 | $132,934 |
| 2021 | $2,806 | $129,487 | $5,250 | $124,237 |
| 2020 | $2,693 | $123,571 | $5,250 | $118,321 |
| 2019 | $2,628 | $123,571 | $5,250 | $118,321 |
| 2018 | $2,644 | $123,571 | $5,250 | $118,321 |
| 2017 | $2,527 | $117,937 | $5,250 | $112,687 |
| 2016 | $2,346 | $117,937 | $5,250 | $112,687 |
| 2015 | $2,273 | $114,655 | $5,250 | $109,405 |
| 2014 | $2,305 | $114,655 | $5,250 | $109,405 |
| 2012 | -- | $112,510 | $5,250 | $107,260 |
Source: Public Records
Map
Nearby Homes