Estimated Value: $425,000 - $450,000
2
Beds
1
Bath
1,622
Sq Ft
$269/Sq Ft
Est. Value
About This Home
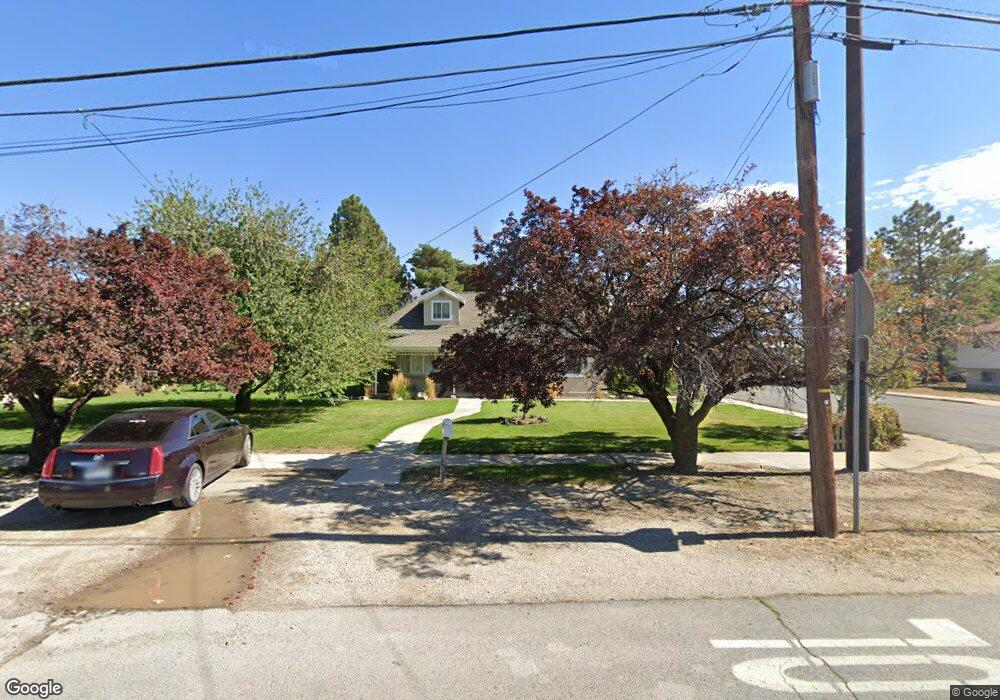
This home is located at 840 N 400 E, Lehi, UT 84043 and is currently estimated at $436,445, approximately $269 per square foot. 840 N 400 E is a home located in Utah County with nearby schools including Sego Lily Elementary School, Lehi Junior High School, and Skyridge High School.
Ownership History
Date
Name
Owned For
Owner Type
Purchase Details
Closed on
Sep 2, 2021
Sold by
Massey Garth Jacob
Bought by
Ahst 209 Llc
Current Estimated Value
Home Financials for this Owner
Home Financials are based on the most recent Mortgage that was taken out on this home.
Original Mortgage
$202,500
Outstanding Balance
$154,569
Interest Rate
2.1%
Mortgage Type
New Conventional
Estimated Equity
$281,876
Purchase Details
Closed on
Feb 27, 2020
Sold by
Barney Tiffany M and Leiendecker Tiffany
Bought by
Barney Tiffany M and Barney Joshua J
Home Financials for this Owner
Home Financials are based on the most recent Mortgage that was taken out on this home.
Original Mortgage
$161,500
Interest Rate
3.6%
Mortgage Type
New Conventional
Purchase Details
Closed on
Sep 29, 2000
Sold by
Sorensen Scott D and Sorensen Debra T
Bought by
Leiendecker Todd and Leiendecker Tiffany
Home Financials for this Owner
Home Financials are based on the most recent Mortgage that was taken out on this home.
Original Mortgage
$131,450
Interest Rate
8.37%
Create a Home Valuation Report for This Property
The Home Valuation Report is an in-depth analysis detailing your home's value as well as a comparison with similar homes in the area
Home Values in the Area
Average Home Value in this Area
Purchase History
| Date | Buyer | Sale Price | Title Company |
|---|---|---|---|
| Ahst 209 Llc | -- | First American Title Ins Co | |
| Barney Tiffany M | -- | Meridian Title Company | |
| Leiendecker Todd | -- | Superior Title Company |
Source: Public Records
Mortgage History
| Date | Status | Borrower | Loan Amount |
|---|---|---|---|
| Open | Ahst 209 Llc | $202,500 | |
| Previous Owner | Barney Tiffany M | $161,500 | |
| Previous Owner | Leiendecker Todd | $131,450 |
Source: Public Records
Tax History Compared to Growth
Tax History
| Year | Tax Paid | Tax Assessment Tax Assessment Total Assessment is a certain percentage of the fair market value that is determined by local assessors to be the total taxable value of land and additions on the property. | Land | Improvement |
|---|---|---|---|---|
| 2025 | $1,604 | $198,770 | $207,800 | $153,600 |
| 2024 | $1,604 | $187,660 | $0 | $0 |
| 2023 | $1,496 | $190,080 | $0 | $0 |
| 2022 | $1,459 | $179,740 | $0 | $0 |
| 2021 | $1,234 | $229,800 | $120,200 | $109,600 |
| 2020 | $1,161 | $213,700 | $111,300 | $102,400 |
| 2019 | $1,111 | $212,600 | $111,300 | $101,300 |
| 2018 | $1,063 | $192,300 | $99,700 | $92,600 |
| 2017 | $1,012 | $97,350 | $0 | $0 |
| 2016 | $963 | $85,965 | $0 | $0 |
| 2015 | $941 | $79,695 | $0 | $0 |
| 2014 | $920 | $77,440 | $0 | $0 |
Source: Public Records
Map
Nearby Homes
- 705 N 400 E
- 7 E State St
- 428 E 500 N
- 832 N Somerset Alley
- 1295 N 190 E
- 68 W State St
- 171 E 400 N
- 1329 N 100 E Unit 21
- 155 W State St Unit TRLR 3
- 996 N 200 W
- 1150 N 200 W Unit 6
- 735 N 1000 E
- 281 N Center St
- 4561 N McKechnie Way Dr Unit 1119
- 1175 E 900 N
- 174 E 100 N
- 143 W 300 N
- 443 W 820 N
- 595 N 1200 E
- 458 N 1100 E Unit 3