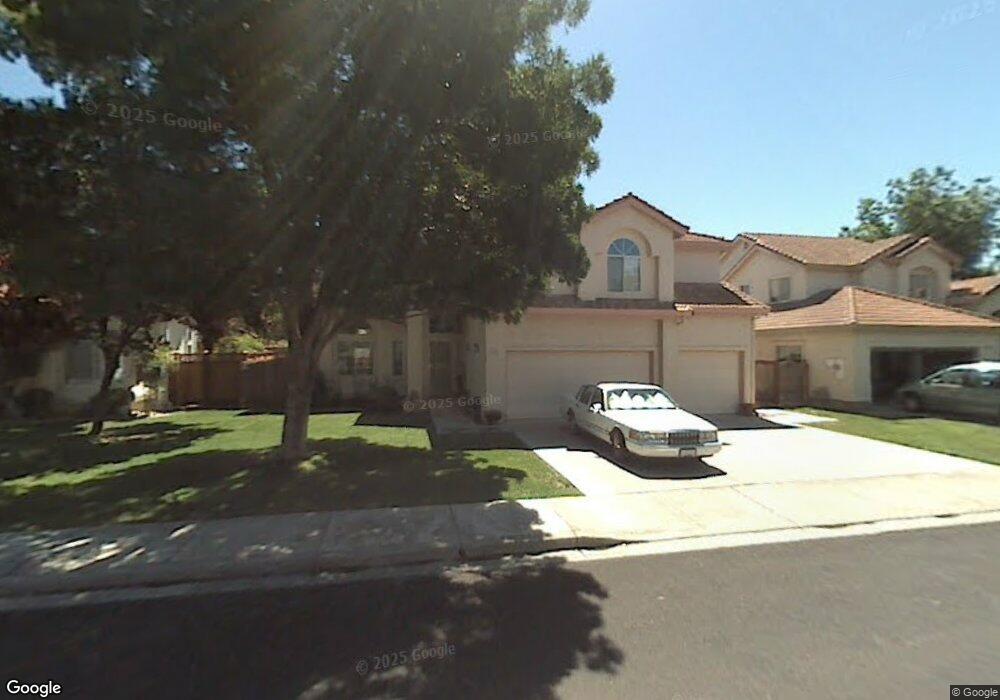
840 Nicholas Ct Brentwood, CA 94513
Estimated Value: $741,745 - $816,000
4
Beds
3
Baths
2,312
Sq Ft
$333/Sq Ft
Est. Value
About This Home
This home is located at 840 Nicholas Ct, Brentwood, CA 94513 and is currently estimated at $770,936, approximately $333 per square foot. 840 Nicholas Ct is a home located in Contra Costa County with nearby schools including Brentwood Elementary School, Edna Hill Middle School, and Liberty High School.
Ownership History
Date
Name
Owned For
Owner Type
Purchase Details
Closed on
Aug 1, 2015
Sold by
Halbritter Tamara L
Bought by
Foglesong Scott
Current Estimated Value
Home Financials for this Owner
Home Financials are based on the most recent Mortgage that was taken out on this home.
Original Mortgage
$352,000
Outstanding Balance
$277,034
Interest Rate
4.05%
Mortgage Type
New Conventional
Estimated Equity
$493,902
Purchase Details
Closed on
Aug 17, 2010
Sold by
Mudd Wallace H and Mudd Virginia E
Bought by
Halbritter Tamara L
Home Financials for this Owner
Home Financials are based on the most recent Mortgage that was taken out on this home.
Original Mortgage
$270,359
Interest Rate
4.51%
Mortgage Type
FHA
Purchase Details
Closed on
Oct 26, 1994
Sold by
Repetto Paul A and Repetto Rochelle Marie
Bought by
Mudd Wallace H and Mudd Virginia E
Home Financials for this Owner
Home Financials are based on the most recent Mortgage that was taken out on this home.
Original Mortgage
$50,000
Interest Rate
5.75%
Mortgage Type
Purchase Money Mortgage
Create a Home Valuation Report for This Property
The Home Valuation Report is an in-depth analysis detailing your home's value as well as a comparison with similar homes in the area
Home Values in the Area
Average Home Value in this Area
Purchase History
| Date | Buyer | Sale Price | Title Company |
|---|---|---|---|
| Foglesong Scott | $440,000 | Old Republic Title Company | |
| Halbritter Tamara L | $274,000 | Old Republic Title Company | |
| Mudd Wallace H | $185,000 | North American Title Company |
Source: Public Records
Mortgage History
| Date | Status | Borrower | Loan Amount |
|---|---|---|---|
| Open | Foglesong Scott | $352,000 | |
| Previous Owner | Halbritter Tamara L | $270,359 | |
| Previous Owner | Mudd Wallace H | $50,000 |
Source: Public Records
Tax History Compared to Growth
Tax History
| Year | Tax Paid | Tax Assessment Tax Assessment Total Assessment is a certain percentage of the fair market value that is determined by local assessors to be the total taxable value of land and additions on the property. | Land | Improvement |
|---|---|---|---|---|
| 2025 | $5,803 | $520,864 | $159,809 | $361,055 |
| 2024 | $5,709 | $510,652 | $156,676 | $353,976 |
| 2023 | $5,709 | $500,640 | $153,604 | $347,036 |
| 2022 | $5,615 | $490,825 | $150,593 | $340,232 |
| 2021 | $15,455 | $481,202 | $147,641 | $333,561 |
| 2019 | $9,944 | $466,931 | $143,263 | $323,668 |
| 2018 | $9,650 | $457,776 | $140,454 | $317,322 |
| 2017 | $9,636 | $448,800 | $137,700 | $311,100 |
| 2016 | $5,004 | $440,000 | $135,000 | $305,000 |
| 2015 | $3,302 | $292,084 | $53,300 | $238,784 |
| 2014 | $3,288 | $286,363 | $52,256 | $234,107 |
Source: Public Records
Map
Nearby Homes
- 951 Dainty Ave
- 801 Villa Terrace
- 875 Villa Terrace
- 967 Dainty Ave
- 524 Bougainvilla Ct
- 800 Queen Palm Ln
- 818 Queen Palm Ln
- 841 Fan Palm Ln
- 0 Road 3
- 730 Bramhall St
- 0 Briones Valley Rd Unit 41100773
- 0 Briones Valley Rd Unit 41100771
- 927 Island Palm Way
- 855 Caribou Terrace
- 8500 Brentwood Blvd
- 3660 Walnut Blvd Unit 40
- 3660 Walnut Blvd Unit 72
- 3660 Walnut Blvd Unit 46
- 3660 Walnut Blvd Unit 65
- 810 Coventry Cir
- 850 Nicholas Ct
- 830 Nicholas Ct
- 815 Fieldstone Ct
- 805 Fieldstone Ct
- 825 Fieldstone Ct
- 820 Nicholas Ct
- 860 Nicholas Ct
- 835 Nicholas Ct
- 825 Nicholas Ct
- 845 Nicholas Ct
- 875 Dainty Ave
- 835 Fieldstone Ct
- 815 Nicholas Ct
- 855 Nicholas Ct
- 810 Nicholas Ct
- 867 Dainty Ave
- 870 Nicholas Ct
- 538 Mandevilla Dr
- 534 Mandevilla Dr
- 805 Nicholas Ct