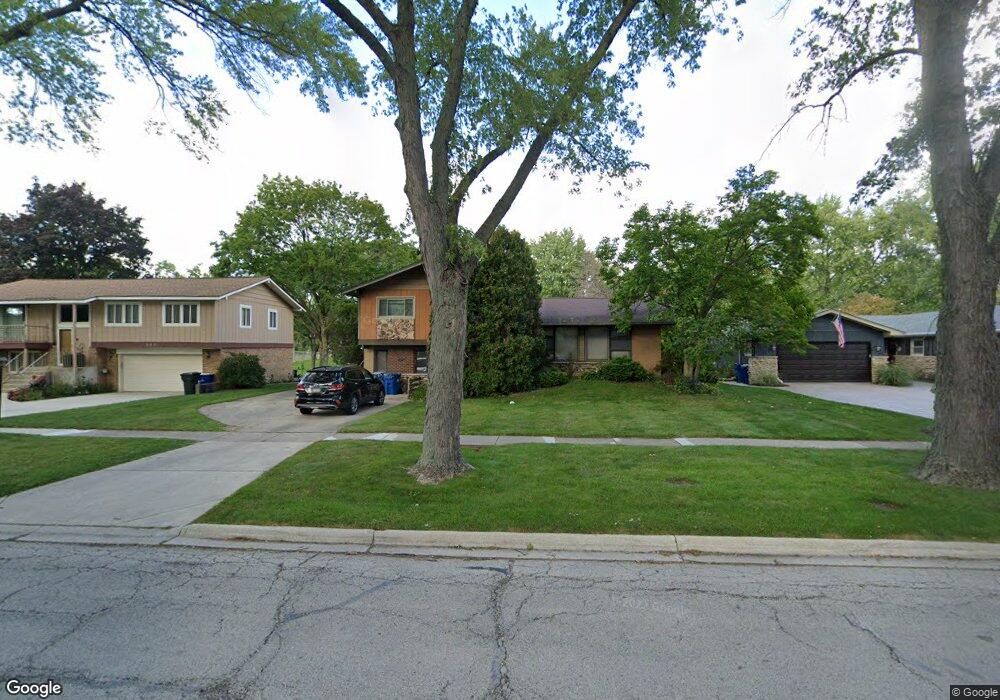
840 Oxford St Downers Grove, IL 60516
South Downers Grove NeighborhoodEstimated Value: $433,175 - $474,000
--
Bed
1
Bath
1,320
Sq Ft
$342/Sq Ft
Est. Value
About This Home
This home is located at 840 Oxford St, Downers Grove, IL 60516 and is currently estimated at $451,294, approximately $341 per square foot. 840 Oxford St is a home located in DuPage County with nearby schools including El Sierra Elementary School, O'Neill Middle School, and Downers Grove South High School.
Ownership History
Date
Name
Owned For
Owner Type
Purchase Details
Closed on
Mar 5, 2011
Sold by
Marshall Thomas J and Marshall Kristen E
Bought by
Marshall Kristen E
Current Estimated Value
Purchase Details
Closed on
May 26, 2000
Sold by
Wessel Mark and Wessel Michelle
Bought by
Marshall Thomas J and Marshall Kristen E
Home Financials for this Owner
Home Financials are based on the most recent Mortgage that was taken out on this home.
Original Mortgage
$111,000
Outstanding Balance
$39,020
Interest Rate
8.18%
Estimated Equity
$412,274
Purchase Details
Closed on
Jun 21, 1994
Sold by
Bailey David M and Bailey Susan R
Bought by
Wessel Mark and Wessel Michele
Home Financials for this Owner
Home Financials are based on the most recent Mortgage that was taken out on this home.
Original Mortgage
$131,000
Interest Rate
8.78%
Create a Home Valuation Report for This Property
The Home Valuation Report is an in-depth analysis detailing your home's value as well as a comparison with similar homes in the area
Home Values in the Area
Average Home Value in this Area
Purchase History
| Date | Buyer | Sale Price | Title Company |
|---|---|---|---|
| Marshall Kristen E | -- | None Available | |
| Marshall Thomas J | $206,000 | -- | |
| Wessel Mark | $249,000 | Attorneys Title Guaranty Fun |
Source: Public Records
Mortgage History
| Date | Status | Borrower | Loan Amount |
|---|---|---|---|
| Open | Marshall Thomas J | $111,000 | |
| Previous Owner | Wessel Mark | $131,000 |
Source: Public Records
Tax History Compared to Growth
Tax History
| Year | Tax Paid | Tax Assessment Tax Assessment Total Assessment is a certain percentage of the fair market value that is determined by local assessors to be the total taxable value of land and additions on the property. | Land | Improvement |
|---|---|---|---|---|
| 2024 | $7,047 | $131,091 | $59,068 | $72,023 |
| 2023 | $6,688 | $120,510 | $54,300 | $66,210 |
| 2022 | $6,330 | $113,560 | $51,170 | $62,390 |
| 2021 | $5,924 | $112,270 | $50,590 | $61,680 |
| 2020 | $5,813 | $110,050 | $49,590 | $60,460 |
| 2019 | $5,624 | $105,590 | $47,580 | $58,010 |
| 2018 | $5,309 | $98,890 | $47,270 | $51,620 |
| 2017 | $5,137 | $95,160 | $45,490 | $49,670 |
| 2016 | $5,030 | $90,810 | $43,410 | $47,400 |
| 2015 | $4,968 | $85,430 | $40,840 | $44,590 |
| 2014 | $4,967 | $83,060 | $39,710 | $43,350 |
| 2013 | $4,866 | $82,670 | $39,520 | $43,150 |
Source: Public Records
Map
Nearby Homes
- 824 Oxford St
- 1003 Oxford St
- 6545 Main St Unit 408
- 6610 Main St
- 1029 Oxford St
- 1108 Carol St
- 824 62nd St
- 6901 Meadowcrest Dr
- 419 63rd St
- 6325 Barrett St
- 6937 Parkview Dr
- 6651 Dunham Rd
- 742 Ridgeview St
- 1208 Connamara Ct
- 7104 Blackburn Ave
- 932 60th Place
- 713 Ridgeview St
- 6722 Sweetbriar Ln
- 714 W 63rd St Unit 202
- 1209 W Charles Ln
- 836 Oxford St
- 900 Oxford St
- 830 Oxford St
- 831 Bonnie Brae Dr
- 825 Bonnie Brae Dr
- 837 Bonnie Brae Dr
- 906 Oxford St
- 819 Bonnie Brae Dr
- 901 Bonnie Brae Dr
- 841 Oxford St
- 901 Oxford St
- 913 Bonnie Brae Dr
- 837 Oxford St
- 6537 Blackstone Dr
- 921 Bonnie Brae Dr
- 831 Oxford St
- 813 Bonnie Brae Dr
- 818 Oxford St
- 6601 Blackstone Dr
- 825 Oxford St