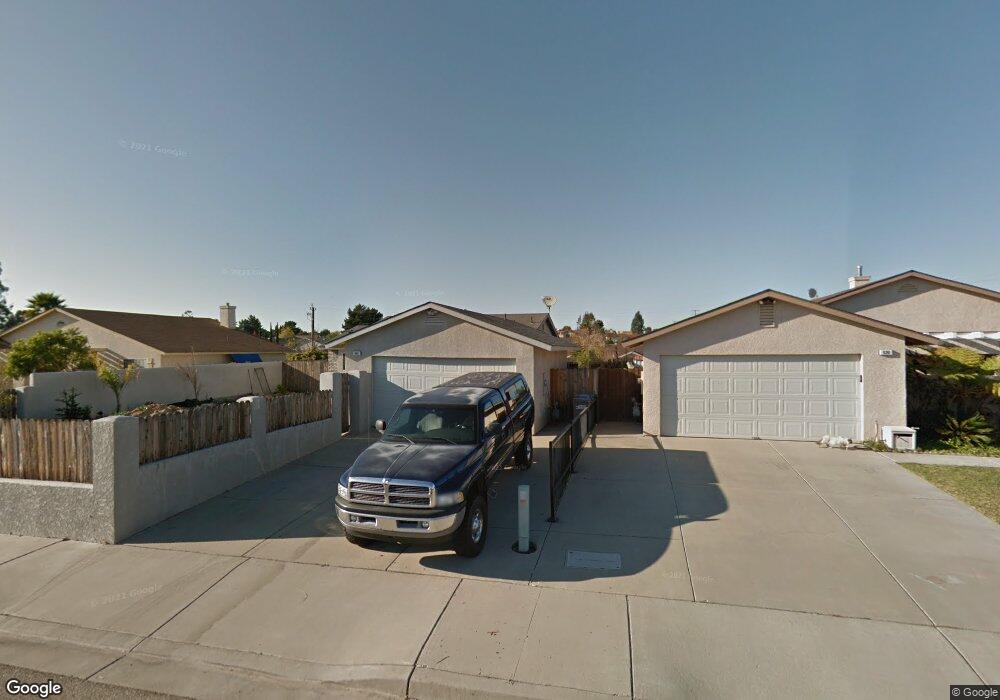
840 Peregrine Ln Nipomo, CA 93444
Estimated Value: $609,021 - $687,000
3
Beds
2
Baths
1,100
Sq Ft
$576/Sq Ft
Est. Value
About This Home
This home is located at 840 Peregrine Ln, Nipomo, CA 93444 and is currently estimated at $633,755, approximately $576 per square foot. 840 Peregrine Ln is a home located in San Luis Obispo County with nearby schools including Dana Elementary School, Mesa Middle School, and Nipomo High School.
Ownership History
Date
Name
Owned For
Owner Type
Purchase Details
Closed on
Oct 1, 2020
Sold by
Austin Matthew J
Bought by
Austin Matthew J and Matthew J Austin Living Trust
Current Estimated Value
Home Financials for this Owner
Home Financials are based on the most recent Mortgage that was taken out on this home.
Original Mortgage
$277,500
Outstanding Balance
$246,372
Interest Rate
2.8%
Mortgage Type
New Conventional
Estimated Equity
$387,383
Purchase Details
Closed on
Apr 19, 2018
Sold by
Austin Matthew J
Bought by
Austin Matthew J and Matthews J Austin Living Trust
Purchase Details
Closed on
May 5, 2009
Sold by
Chevy Chase Bank Fsb
Bought by
Austin Matthew J
Home Financials for this Owner
Home Financials are based on the most recent Mortgage that was taken out on this home.
Original Mortgage
$274,928
Interest Rate
4.8%
Mortgage Type
FHA
Purchase Details
Closed on
Feb 11, 2009
Sold by
Cutting Bruce B and Michelle Cutting D
Bought by
Chevy Chase Bank
Purchase Details
Closed on
Dec 30, 2005
Sold by
Stinnett Mary E and Stinett Mary E
Bought by
Cutting Bruce B and Michelle Cutting D
Home Financials for this Owner
Home Financials are based on the most recent Mortgage that was taken out on this home.
Original Mortgage
$67,500
Interest Rate
6.16%
Mortgage Type
Stand Alone Second
Purchase Details
Closed on
May 25, 2004
Sold by
Miramontes Geraldo and Miramontes Maria
Bought by
Stinett Mary E
Purchase Details
Closed on
Aug 22, 2002
Sold by
Schneider Robert F and Schneider Elizabeth A
Bought by
Miramontes Gerardo and Miramontes Maria
Home Financials for this Owner
Home Financials are based on the most recent Mortgage that was taken out on this home.
Original Mortgage
$231,200
Interest Rate
6.22%
Purchase Details
Closed on
Feb 27, 2002
Sold by
Hernandez Aurelio M and Hernandez Rosa Ma
Bought by
Hernandez Aurelio M and Hernandez Rosa Maria
Purchase Details
Closed on
Oct 31, 1994
Sold by
Bonita Homes Inc
Bought by
Schneider Robert F and Schneider Elizabeth A
Home Financials for this Owner
Home Financials are based on the most recent Mortgage that was taken out on this home.
Original Mortgage
$121,370
Interest Rate
9.23%
Mortgage Type
FHA
Create a Home Valuation Report for This Property
The Home Valuation Report is an in-depth analysis detailing your home's value as well as a comparison with similar homes in the area
Home Values in the Area
Average Home Value in this Area
Purchase History
| Date | Buyer | Sale Price | Title Company |
|---|---|---|---|
| Austin Matthew J | -- | Amrock Inc | |
| Austin Matthew J | -- | Amrock Inc | |
| Austin Matthew J | -- | None Available | |
| Austin Matthew J | $280,000 | Multiple | |
| Chevy Chase Bank | $242,250 | None Available | |
| Cutting Bruce B | $450,000 | First American Title Co | |
| Stinett Mary E | $379,000 | Cuesta Title Company | |
| Miramontes Gerardo | $289,000 | Chicago Title Company | |
| Hernandez Aurelio M | -- | -- | |
| Schneider Robert F | $123,000 | Cuesta Title Guaranty Compan |
Source: Public Records
Mortgage History
| Date | Status | Borrower | Loan Amount |
|---|---|---|---|
| Open | Austin Matthew J | $277,500 | |
| Closed | Austin Matthew J | $274,928 | |
| Previous Owner | Cutting Bruce B | $67,500 | |
| Previous Owner | Cutting Bruce B | $360,000 | |
| Previous Owner | Miramontes Gerardo | $231,200 | |
| Previous Owner | Schneider Robert F | $121,370 | |
| Closed | Miramontes Gerardo | $57,800 |
Source: Public Records
Tax History Compared to Growth
Tax History
| Year | Tax Paid | Tax Assessment Tax Assessment Total Assessment is a certain percentage of the fair market value that is determined by local assessors to be the total taxable value of land and additions on the property. | Land | Improvement |
|---|---|---|---|---|
| 2025 | $3,653 | $360,555 | $199,593 | $160,962 |
| 2024 | $3,610 | $353,486 | $195,680 | $157,806 |
| 2023 | $3,610 | $346,556 | $191,844 | $154,712 |
| 2022 | $3,554 | $339,762 | $188,083 | $151,679 |
| 2021 | $3,547 | $333,101 | $184,396 | $148,705 |
| 2020 | $3,505 | $329,687 | $182,506 | $147,181 |
| 2019 | $3,483 | $323,224 | $178,928 | $144,296 |
| 2018 | $3,440 | $316,887 | $175,420 | $141,467 |
| 2017 | $3,374 | $310,675 | $171,981 | $138,694 |
| 2016 | $3,182 | $304,584 | $168,609 | $135,975 |
| 2015 | $3,135 | $300,010 | $166,077 | $133,933 |
| 2014 | $3,018 | $294,134 | $162,824 | $131,310 |
Source: Public Records
Map
Nearby Homes
- 232 Scarlett Cir
- 483 Violet Ave
- Mesa Plan at Hill Street Terraces - Hill Street Series
- Pacific Plan at Hill Street Terraces - Hill Street Series
- Monarch Plan at Hill Street Terraces - Hill Street Series
- Rancho Plan at Hill Street Terraces - Hill Street Series
- Dana Plan at Hill Street Terraces - Hill Street Series
- 522 Higos Way
- 680 Hill St
- 719 W Tefft St
- 261 Hazel Ln
- 457 Polaris Dr
- 945 Jeanette Ln
- 426 Polaris Dr
- 759 Viola Ct
- 626 Juno Ct
- 840 Story St
- 368 Avenida de Amigos
- 725 Monarch Ln
- 450 Avenida de Socios Unit 12
- 830 Peregrine Ln
- 820 Peregrine Ln
- 860 Peregrine Ln
- 325 Kestrel Way
- 320 Kestrel Way
- 810 Peregrine Ln
- 840 Grande Ave
- 870 Peregrine Ln
- 295 Jasper Place
- 830 Grande Ave
- 335 Kestrel Way
- 320 Black Hawk Way
- 330 Kestrel Way
- 880 Peregrine Ln
- 875 Peregrine Ln
- 298 Black Hawk Way
- 330 Black Hawk Way
- 345 Kestrel Way
- 845 Chata St