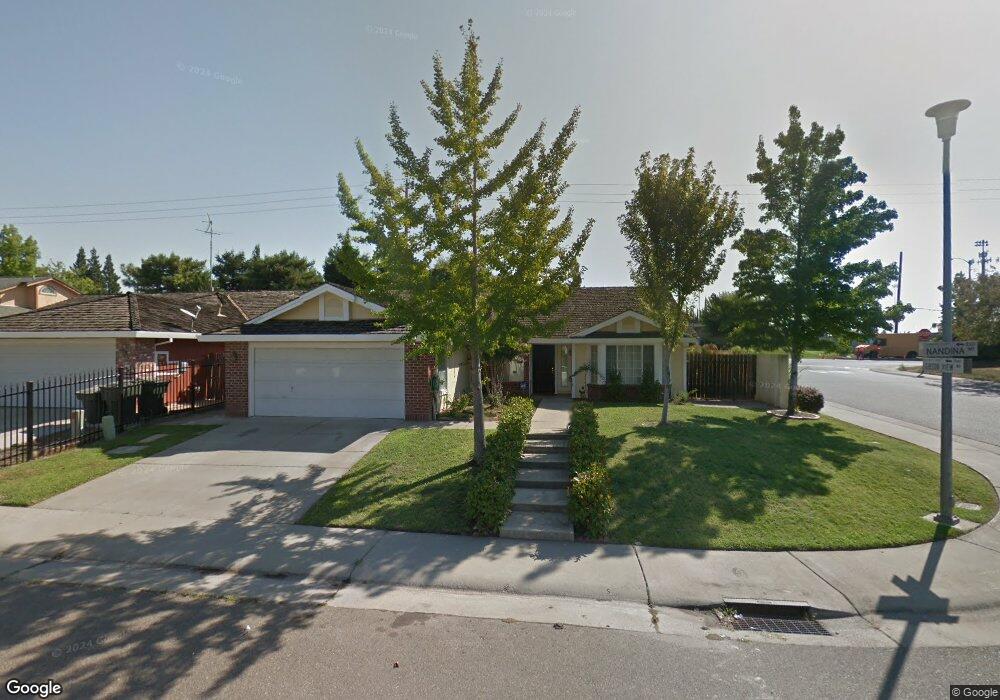
8400 Nandina Way Antelope, CA 95843
Estimated Value: $472,000 - $529,000
3
Beds
2
Baths
1,736
Sq Ft
$288/Sq Ft
Est. Value
About This Home
This home is located at 8400 Nandina Way, Antelope, CA 95843 and is currently estimated at $500,639, approximately $288 per square foot. 8400 Nandina Way is a home located in Sacramento County with nearby schools including Arthur S. Dudley Elementary School, Wilson C. Riles Middle School, and Center High School.
Ownership History
Date
Name
Owned For
Owner Type
Purchase Details
Closed on
Sep 8, 2010
Sold by
Us Bank National Association
Bought by
Pan Wan Qiong
Current Estimated Value
Home Financials for this Owner
Home Financials are based on the most recent Mortgage that was taken out on this home.
Original Mortgage
$166,667
Outstanding Balance
$110,390
Interest Rate
4.5%
Mortgage Type
FHA
Estimated Equity
$390,249
Purchase Details
Closed on
Jul 26, 2010
Sold by
Stever Ronald R and Stever Patricia L
Bought by
Us Bank National Association and Sabr 2006 Nc2
Home Financials for this Owner
Home Financials are based on the most recent Mortgage that was taken out on this home.
Original Mortgage
$166,667
Outstanding Balance
$110,390
Interest Rate
4.5%
Mortgage Type
FHA
Estimated Equity
$390,249
Create a Home Valuation Report for This Property
The Home Valuation Report is an in-depth analysis detailing your home's value as well as a comparison with similar homes in the area
Home Values in the Area
Average Home Value in this Area
Purchase History
| Date | Buyer | Sale Price | Title Company |
|---|---|---|---|
| Pan Wan Qiong | $171,000 | Orange Coast Title Lender Se | |
| Us Bank National Association | $399,817 | Accommodation |
Source: Public Records
Mortgage History
| Date | Status | Borrower | Loan Amount |
|---|---|---|---|
| Open | Pan Wan Qiong | $166,667 |
Source: Public Records
Tax History Compared to Growth
Tax History
| Year | Tax Paid | Tax Assessment Tax Assessment Total Assessment is a certain percentage of the fair market value that is determined by local assessors to be the total taxable value of land and additions on the property. | Land | Improvement |
|---|---|---|---|---|
| 2025 | $2,567 | $219,068 | $108,894 | $110,174 |
| 2024 | $2,567 | $214,773 | $106,759 | $108,014 |
| 2023 | $2,513 | $210,563 | $104,666 | $105,897 |
| 2022 | $2,410 | $206,435 | $102,614 | $103,821 |
| 2021 | $2,475 | $202,388 | $100,602 | $101,786 |
| 2020 | $2,669 | $200,314 | $99,571 | $100,743 |
| 2019 | $2,430 | $196,387 | $97,619 | $98,768 |
| 2018 | $2,375 | $192,537 | $95,705 | $96,832 |
| 2017 | $2,303 | $188,763 | $93,829 | $94,934 |
| 2016 | $2,260 | $185,063 | $91,990 | $93,073 |
| 2015 | $2,096 | $182,284 | $90,609 | $91,675 |
| 2014 | $2,140 | $178,715 | $88,835 | $89,880 |
Source: Public Records
Map
Nearby Homes
- 8447 Leaning Tree Ct
- 8148 Orchid Tree Way
- 3326 El Castillo Ct
- 3312 Groveland Way
- 8126 Great House Way
- 3310 El Valle Way
- 3313 Gray Mare Way
- 8413 Silver Run Way
- 3512 Merano Way
- 7984 Skeena Ct
- 3713 Black Eagle Dr
- 8548 Brisenbourg Way
- 8404 Giverny Cir
- 8529 Giverny Cir
- 2816 Balaton Ct
- 8522 Thornbury Dr
- 7865 Valley Quail Ct
- 8631 Aspen Ridge Ct
- 8534 Shadow Crest Cir
- 8253 Northam Dr
- 8404 Nandina Way
- 8408 Nandina Way
- 2939 Gibson View Way
- 2946 Gibson View Way
- 2944 Gibson View Way
- 8407 Nandina Way
- 8412 Nandina Way
- 2940 Gibson View Way
- 2935 Gibson View Way
- 8411 Nandina Way
- 2936 Gibson View Way
- 8416 Nandina Way
- 8344 Raffia Ct
- 8415 Nandina Way
- 8340 Raffia Ct
- 2932 Gibson View Way
- 3024 Glentana Way
- 2931 Gibson View Way
- 8406 Deer Fern Ct
- 8341 Raffia Ct