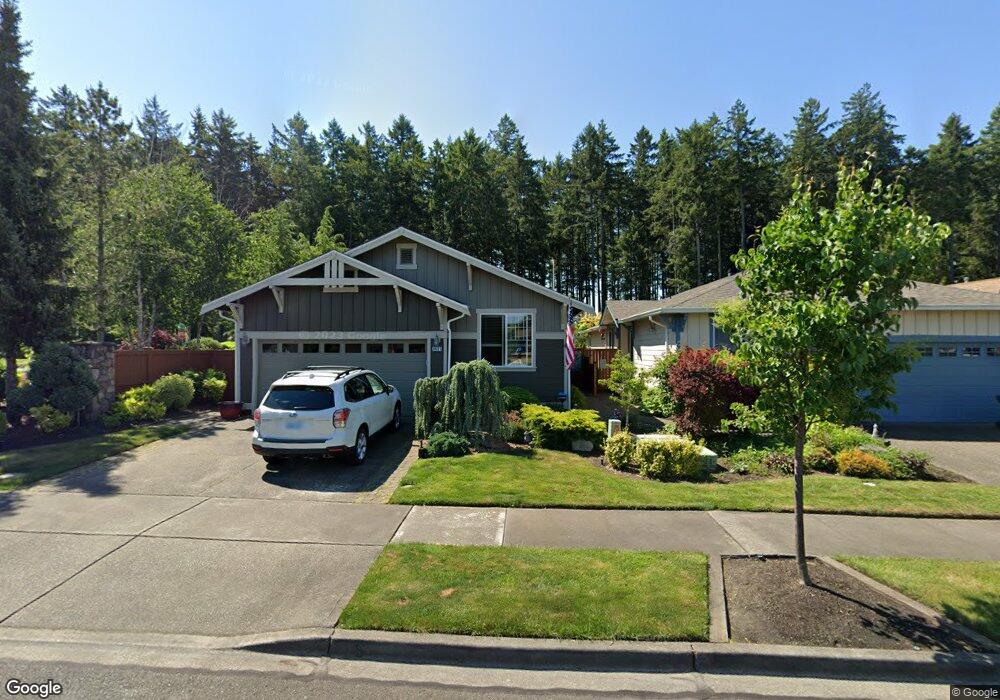
8401 Bainbridge Loop NE Unit 2 Lacey, WA 98516
Jubilee NeighborhoodEstimated Value: $461,000 - $517,000
2
Beds
2
Baths
1,392
Sq Ft
$349/Sq Ft
Est. Value
About This Home
This home is located at 8401 Bainbridge Loop NE Unit 2, Lacey, WA 98516 and is currently estimated at $486,412, approximately $349 per square foot. 8401 Bainbridge Loop NE Unit 2 is a home located in Thurston County with nearby schools including Olympic View Elementary School, Chinook Middle School, and North Thurston High School.
Ownership History
Date
Name
Owned For
Owner Type
Purchase Details
Closed on
Jun 21, 2017
Sold by
Thomas N & Mary C Higgins Trust
Bought by
Higgins Thomas N and Higgins Mary C
Current Estimated Value
Purchase Details
Closed on
Jan 25, 2011
Sold by
Higgins Thomas N and Higgins Mary C
Bought by
Higgins Thomas N and Higgins Mary C
Purchase Details
Closed on
May 15, 2007
Sold by
Higgins Mary C and Pool Mary C
Bought by
Higgins Thomas N and Higgins Mary C
Purchase Details
Closed on
Nov 2, 2004
Sold by
Hawks Prairie Land Associates Llc
Bought by
Pool Mary C
Home Financials for this Owner
Home Financials are based on the most recent Mortgage that was taken out on this home.
Original Mortgage
$187,855
Outstanding Balance
$91,196
Interest Rate
5.79%
Mortgage Type
New Conventional
Estimated Equity
$395,216
Create a Home Valuation Report for This Property
The Home Valuation Report is an in-depth analysis detailing your home's value as well as a comparison with similar homes in the area
Home Values in the Area
Average Home Value in this Area
Purchase History
| Date | Buyer | Sale Price | Title Company |
|---|---|---|---|
| Higgins Thomas N | -- | None Available | |
| Higgins Thomas N | -- | None Available | |
| Higgins Thomas N | -- | None Available | |
| Pool Mary C | $234,819 | First American Title |
Source: Public Records
Mortgage History
| Date | Status | Borrower | Loan Amount |
|---|---|---|---|
| Open | Pool Mary C | $187,855 |
Source: Public Records
Tax History
| Year | Tax Paid | Tax Assessment Tax Assessment Total Assessment is a certain percentage of the fair market value that is determined by local assessors to be the total taxable value of land and additions on the property. | Land | Improvement |
|---|---|---|---|---|
| 2025 | $3,717 | $410,700 | $179,100 | $231,600 |
| 2024 | $3,717 | $388,900 | $173,800 | $215,100 |
| 2023 | $3,717 | $388,600 | $153,200 | $235,400 |
| 2022 | $3,766 | $339,800 | $82,600 | $257,200 |
| 2021 | $3,589 | $323,600 | $81,500 | $242,100 |
| 2020 | $3,316 | $287,300 | $86,300 | $201,000 |
| 2019 | $2,967 | $275,700 | $87,300 | $188,400 |
| 2018 | $3,338 | $248,600 | $81,600 | $167,000 |
| 2017 | $3,102 | $243,400 | $79,200 | $164,200 |
| 2016 | $2,923 | $230,050 | $73,250 | $156,800 |
| 2014 | -- | $223,650 | $73,250 | $150,400 |
Source: Public Records
Map
Nearby Homes
- 8336 Bainbridge Loop NE
- 8536 Bainbridge Loop NE Unit 1
- 8650 Bainbridge Loop NE Unit 1
- 8218 Camano Loop NE
- 4316 Harstene St NE
- 4335 Dudley Dr NE
- 4212 Vashon Dr NE
- 3708 Lanyard Dr NE
- 3629 Lanyard Dr NE
- 3947 Jett Ln NE
- 4258 Dudley Dr NE
- 4420 Vashon Dr NE
- 8025 Columbia Way NE
- 3974 Cameron Dr NE
- 8231 Orcas Loop NE
- 8265 Orcas Loop NE
- 3526 Becket St NE
- 4100 Cashmere Dr NE
- 4433 Cashmere Dr NE
- 4717 Bend Ct NE
- 8353 Bainbridge Loop NE
- 8345 Bainbridge Loop NE
- 8400 Bainbridge Loop NE
- 8404 Bainbridge Loop NE Unit 1
- 8350 Bainbridge Loop NE Unit 1
- 8341 Bainbridge Loop NE Unit 2
- 8344 Bainbridge Loop NE Unit 1
- 8337 Bainbridge Loop NE
- 8421 Bainbridge Loop NE
- 8340 Bainbridge Loop NE Unit 1
- 8425 Bainbridge Loop NE Unit 2
- 8416 Bainbridge Loop NE Unit 1
- 8333 Bainbridge Loop NE Unit 2
- 8422 Bainbridge Loop NE Unit 1
- 8429 Bainbridge Loop NE Unit 2
- 8504 Bainbridge Loop NE
- 8508 Bainbridge Loop NE
- 8329 Bainbridge Loop NE
- 8482 Bainbridge Loop NE Unit 1
Your Personal Tour Guide
Ask me questions while you tour the home.