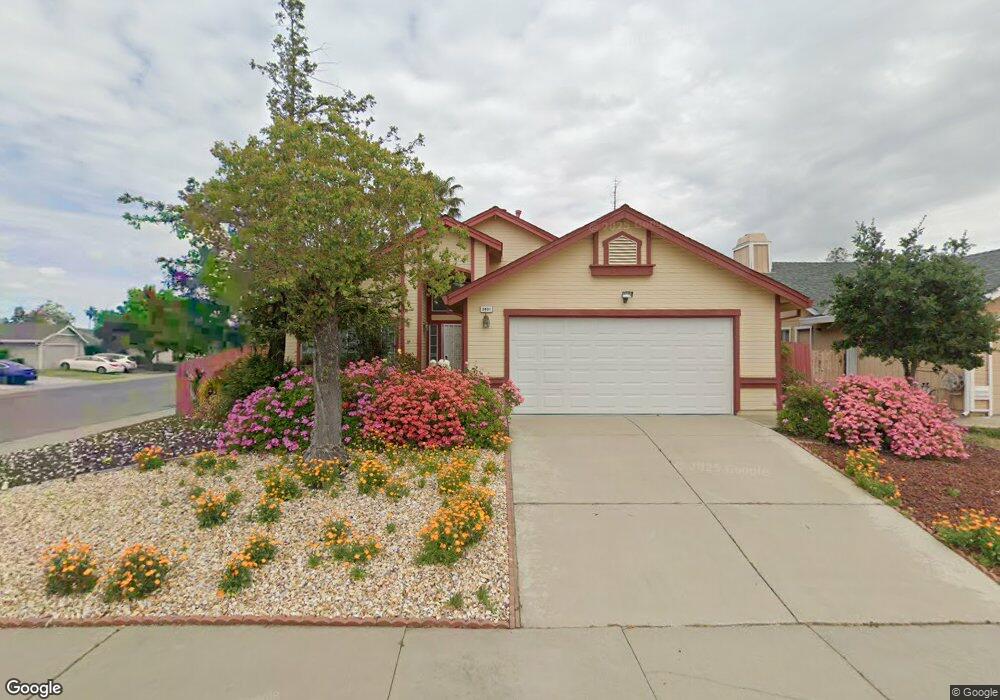
8401 Baretta Ct Sacramento, CA 95828
Estimated Value: $436,000 - $519,000
3
Beds
2
Baths
1,712
Sq Ft
$291/Sq Ft
Est. Value
About This Home
This home is located at 8401 Baretta Ct, Sacramento, CA 95828 and is currently estimated at $498,035, approximately $290 per square foot. 8401 Baretta Ct is a home located in Sacramento County with nearby schools including Isabelle Jackson Elementary School, Edward Harris Jr. Middle School, and Monterey Trail High School.
Ownership History
Date
Name
Owned For
Owner Type
Purchase Details
Closed on
May 29, 2012
Sold by
Barraza Jesus
Bought by
Barraza Jesus and Jesus Barraza Trust
Current Estimated Value
Purchase Details
Closed on
Mar 21, 2006
Sold by
Barraza Araceli
Bought by
Barraza Jesus
Purchase Details
Closed on
Mar 20, 2006
Sold by
Thai Quan
Bought by
Barrazza Jesus
Purchase Details
Closed on
Nov 3, 1996
Sold by
Thai Nghiem Ky and Thai Lua
Bought by
Thai Nghiem Ky and Thai Quan
Purchase Details
Closed on
Oct 7, 1994
Sold by
Carney Michael P and Carney Kelly
Bought by
Lua Thai Nghiem Ky and Lua Thai
Home Financials for this Owner
Home Financials are based on the most recent Mortgage that was taken out on this home.
Original Mortgage
$84,000
Interest Rate
8.7%
Create a Home Valuation Report for This Property
The Home Valuation Report is an in-depth analysis detailing your home's value as well as a comparison with similar homes in the area
Home Values in the Area
Average Home Value in this Area
Purchase History
| Date | Buyer | Sale Price | Title Company |
|---|---|---|---|
| Barraza Jesus | -- | None Available | |
| Barraza Jesus | -- | First American Title Co | |
| Barrazza Jesus | $339,000 | First American Title Co | |
| Thai Nghiem Ky | -- | -- | |
| Lua Thai Nghiem Ky | $120,000 | Chicago Title Co |
Source: Public Records
Mortgage History
| Date | Status | Borrower | Loan Amount |
|---|---|---|---|
| Previous Owner | Lua Thai Nghiem Ky | $84,000 |
Source: Public Records
Tax History Compared to Growth
Tax History
| Year | Tax Paid | Tax Assessment Tax Assessment Total Assessment is a certain percentage of the fair market value that is determined by local assessors to be the total taxable value of land and additions on the property. | Land | Improvement |
|---|---|---|---|---|
| 2025 | $4,994 | $463,252 | $122,982 | $340,270 |
| 2024 | $4,994 | $454,170 | $120,571 | $333,599 |
| 2023 | $4,868 | $445,265 | $118,207 | $327,058 |
| 2022 | $4,784 | $436,536 | $115,890 | $320,646 |
| 2021 | $3,612 | $322,588 | $85,642 | $236,946 |
| 2020 | $3,207 | $285,477 | $75,790 | $209,687 |
| 2019 | $3,011 | $266,802 | $70,832 | $195,970 |
| 2018 | $2,879 | $256,541 | $68,108 | $188,433 |
| 2017 | $2,706 | $239,759 | $63,653 | $176,106 |
| 2016 | $2,442 | $222,000 | $58,938 | $163,062 |
| 2015 | $2,228 | $201,819 | $53,580 | $148,239 |
| 2014 | $2,116 | $190,395 | $50,547 | $139,848 |
Source: Public Records
Map
Nearby Homes
- 8317 Honeycomb Way
- 8233 Short Rd
- 8437 Yermo Way
- 8336 Cutler Way
- 8012 Northern Oak Cir
- 8216 Exbourne Cir
- 8251 Apple Cove Ct
- 8159 Morgan Hill Way
- 8569 Alissa Way
- 8186 Gustine Way
- 8581 Petunia Way
- 8513 Sheldon North Dr
- 8346 Floxtree Ct
- 8510 Cavendish Way
- 8077 Goran Ct
- 8476 W Stockton Blvd Unit 1
- 7905 Springarden Way
- 8170 Derbyshire Cir
- 8772 Crusheen Way
- 7715 Cotton Ln
- 8405 Baretta Ct
- 8279 Olander Way
- 8409 Baretta Ct
- 8275 Olander Way
- 8310 Cliffcrest Dr
- 8304 Cliffcrest Dr
- 8400 Baretta Ct
- 8314 Cliffcrest Dr
- 8271 Olander Way
- 8413 Baretta Ct
- 8404 Baretta Ct
- 8300 Cliffcrest Dr
- 8408 Baretta Ct
- 8318 Cliffcrest Dr
- 8267 Olander Way
- 8417 Baretta Ct
- 8412 Baretta Ct
- 8290 Cliffcrest Dr
- 8322 Cliffcrest Dr
- 8323 Blue Quail Ct