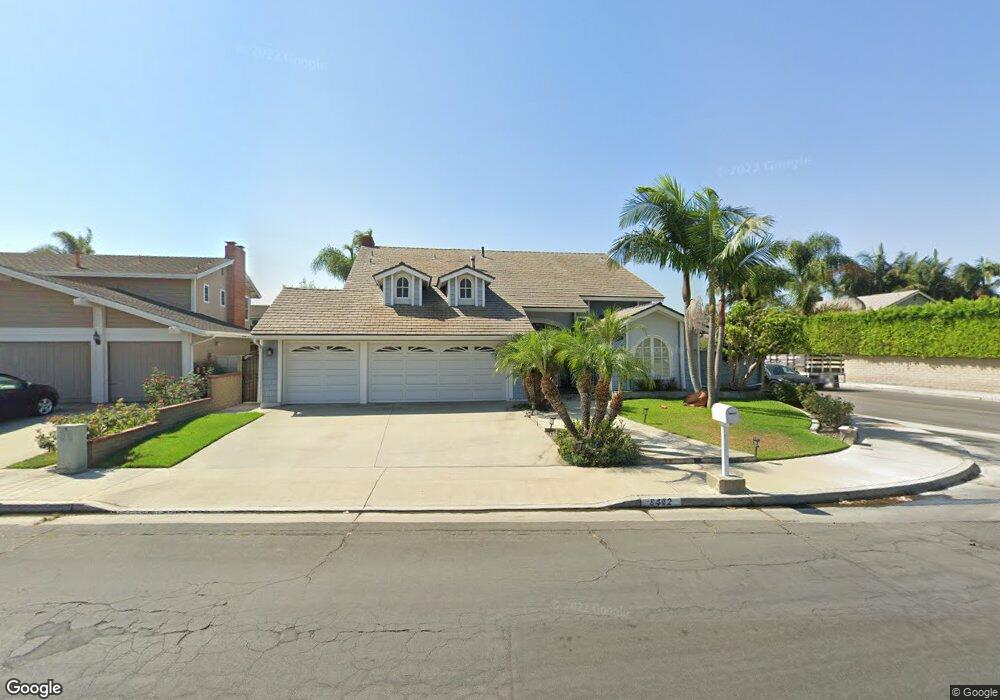
8402 Deepview Dr Huntington Beach, CA 92646
Estimated Value: $1,849,000 - $2,223,000
4
Beds
3
Baths
2,593
Sq Ft
$762/Sq Ft
Est. Value
About This Home
This home is located at 8402 Deepview Dr, Huntington Beach, CA 92646 and is currently estimated at $1,976,442, approximately $762 per square foot. 8402 Deepview Dr is a home located in Orange County with nearby schools including John R. Peterson Elementary, Ethel Dwyer Middle, and Huntington Beach High School.
Ownership History
Date
Name
Owned For
Owner Type
Purchase Details
Closed on
Jul 27, 2009
Sold by
Eimer Heidi May
Bought by
Nanko James R
Current Estimated Value
Home Financials for this Owner
Home Financials are based on the most recent Mortgage that was taken out on this home.
Original Mortgage
$676,000
Interest Rate
5.37%
Mortgage Type
Purchase Money Mortgage
Purchase Details
Closed on
Jun 19, 2009
Sold by
Nanko James R
Bought by
Kerrigan Patrick W and Kerrigan Hai Linh
Home Financials for this Owner
Home Financials are based on the most recent Mortgage that was taken out on this home.
Original Mortgage
$676,000
Interest Rate
5.37%
Mortgage Type
Purchase Money Mortgage
Purchase Details
Closed on
Jul 15, 1999
Sold by
Security Trust Company
Bought by
Nanko James R
Create a Home Valuation Report for This Property
The Home Valuation Report is an in-depth analysis detailing your home's value as well as a comparison with similar homes in the area
Home Values in the Area
Average Home Value in this Area
Purchase History
| Date | Buyer | Sale Price | Title Company |
|---|---|---|---|
| Nanko James R | -- | Lawyers Title | |
| Kerrigan Patrick W | $845,000 | Lawyers Title | |
| Nanko James R | -- | Chicago Title Co |
Source: Public Records
Mortgage History
| Date | Status | Borrower | Loan Amount |
|---|---|---|---|
| Previous Owner | Kerrigan Patrick W | $676,000 |
Source: Public Records
Tax History Compared to Growth
Tax History
| Year | Tax Paid | Tax Assessment Tax Assessment Total Assessment is a certain percentage of the fair market value that is determined by local assessors to be the total taxable value of land and additions on the property. | Land | Improvement |
|---|---|---|---|---|
| 2025 | $12,105 | $1,090,739 | $797,692 | $293,047 |
| 2024 | $12,105 | $1,069,352 | $782,051 | $287,301 |
| 2023 | $11,835 | $1,048,385 | $766,717 | $281,668 |
| 2022 | $11,525 | $1,027,829 | $751,683 | $276,146 |
| 2021 | $11,309 | $1,007,676 | $736,944 | $270,732 |
| 2020 | $11,236 | $997,344 | $729,388 | $267,956 |
| 2019 | $11,099 | $977,789 | $715,087 | $262,702 |
| 2018 | $10,927 | $958,617 | $701,066 | $257,551 |
| 2017 | $10,781 | $939,821 | $687,320 | $252,501 |
| 2016 | $10,296 | $921,394 | $673,844 | $247,550 |
| 2015 | $10,198 | $907,554 | $663,722 | $243,832 |
| 2014 | $9,984 | $889,777 | $650,721 | $239,056 |
Source: Public Records
Map
Nearby Homes
- 8401 Dallas Cir
- 8582 Salt Lake Dr
- 8291 Polk Cir
- 20012 Treasure Cir
- 20162 S New Britain Ln
- 8472 Norfolk Dr
- 20131 Crown Reef Ln
- 8182 Mainsail Dr Unit 203
- 20251 Lighthouse Ln
- 20191 Imperial Cove Ln
- 8801 Albatross Dr
- 20302 Tidepool Cir Unit 204
- 20251 Cape Coral Ln Unit 315
- 20301 Bluffside Cir Unit D401
- 20301 Bluffside Cir Unit D312
- 19321 Beach Blvd
- 20331 Bluffside Cir Unit 411
- 20331 Bluffside Cir Unit A108
- 20331 Bluffside Cir Unit 303
- 20331 Bluffside Cir Unit 222
- 8412 Deepview Dr
- 8422 Deepview Dr
- 8411 Dallas Cir
- 8372 Deepview Dr
- 19801 Flagstone Ln
- 8411 Deepview Dr
- 8391 Deepview Dr
- 8421 Dallas Cir
- 8421 Deepview Dr
- 8442 Deepview Dr
- 19821 Flagstone Ln
- 8431 Deepview Dr
- 8362 Deepview Dr
- 8441 Dallas Cir
- 8371 Deepview Dr
- 19831 Flagstone Ln
- 19782 Edgewood Ln
- 8441 Deepview Dr
- 8412 Hurstwell Dr
- 8392 Hurstwell Dr