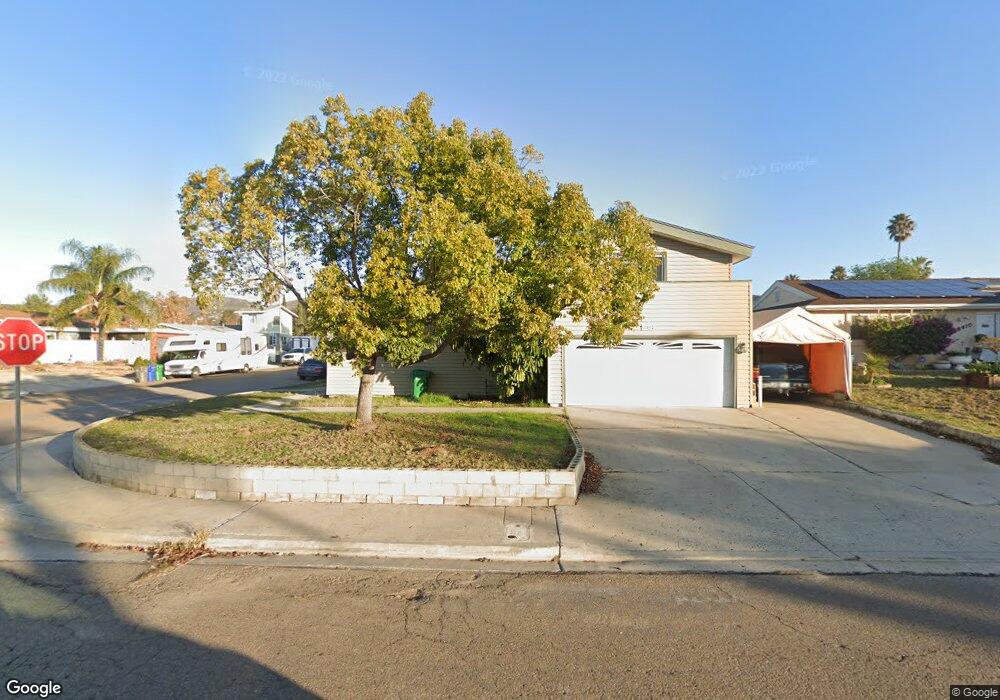
8402 Kreiner Way Santee, CA 92071
East Elliott NeighborhoodEstimated Value: $839,154 - $887,000
4
Beds
3
Baths
1,550
Sq Ft
$560/Sq Ft
Est. Value
About This Home
This home is located at 8402 Kreiner Way, Santee, CA 92071 and is currently estimated at $867,789, approximately $559 per square foot. 8402 Kreiner Way is a home located in San Diego County with nearby schools including Carlton Oaks Elementary School and West Hills High School.
Ownership History
Date
Name
Owned For
Owner Type
Purchase Details
Closed on
Jan 29, 2003
Sold by
Vicker Bruce W and Vicker Rhonda S
Bought by
Vicker Rhonda S
Current Estimated Value
Home Financials for this Owner
Home Financials are based on the most recent Mortgage that was taken out on this home.
Original Mortgage
$229,000
Outstanding Balance
$97,359
Interest Rate
5.85%
Estimated Equity
$770,430
Purchase Details
Closed on
Apr 16, 1997
Sold by
Invest Corp
Bought by
Vicker Bruce W and Vicker Rhonda S
Home Financials for this Owner
Home Financials are based on the most recent Mortgage that was taken out on this home.
Original Mortgage
$163,098
Interest Rate
7.86%
Mortgage Type
VA
Purchase Details
Closed on
Jan 10, 1997
Sold by
Chiariello George Frank and Chiariello Hortense P
Bought by
Invest Corp
Purchase Details
Closed on
Jun 22, 1996
Sold by
Chiariello George F and Chiariello Hortense P
Bought by
Chiariello Charlie
Create a Home Valuation Report for This Property
The Home Valuation Report is an in-depth analysis detailing your home's value as well as a comparison with similar homes in the area
Home Values in the Area
Average Home Value in this Area
Purchase History
| Date | Buyer | Sale Price | Title Company |
|---|---|---|---|
| Vicker Rhonda S | -- | Diversified Title & Escrow S | |
| Vicker Bruce W | $160,000 | Commonwealth Land Title Co | |
| Invest Corp | $39,316 | Old Republic Title Company | |
| Chiariello Charlie | -- | -- |
Source: Public Records
Mortgage History
| Date | Status | Borrower | Loan Amount |
|---|---|---|---|
| Open | Vicker Rhonda S | $229,000 | |
| Closed | Vicker Bruce W | $163,098 |
Source: Public Records
Tax History Compared to Growth
Tax History
| Year | Tax Paid | Tax Assessment Tax Assessment Total Assessment is a certain percentage of the fair market value that is determined by local assessors to be the total taxable value of land and additions on the property. | Land | Improvement |
|---|---|---|---|---|
| 2025 | $3,097 | $260,398 | $97,706 | $162,692 |
| 2024 | $3,097 | $255,293 | $95,791 | $159,502 |
| 2023 | $3,000 | $250,288 | $93,913 | $156,375 |
| 2022 | $2,975 | $245,381 | $92,072 | $153,309 |
| 2021 | $2,931 | $240,570 | $90,267 | $150,303 |
| 2020 | $2,895 | $238,104 | $89,342 | $148,762 |
| 2019 | $2,794 | $233,437 | $87,591 | $145,846 |
| 2018 | $2,735 | $228,861 | $85,874 | $142,987 |
| 2017 | $2,698 | $224,375 | $84,191 | $140,184 |
| 2016 | $2,615 | $219,977 | $82,541 | $137,436 |
| 2015 | $2,580 | $216,674 | $81,302 | $135,372 |
| 2014 | $2,527 | $212,431 | $79,710 | $132,721 |
Source: Public Records
Map
Nearby Homes
- 9256 Allano Way
- 8339 Carlton Oaks Dr
- 9058 Inverness Rd
- 8609 Dunwoodie Rd
- 45 Via Sovana Unit 45
- 36 Via Sovana Unit 36
- 120 Via Sovana
- 8069 Mission George Rd Unit 1
- 8732 Crossway Ct Unit 33
- 8732 Crossway Ct Unit 36
- 19 Carribean Way
- 8301 Mission Gorge Rd
- 8301 Mission Gorge Rd Unit 169
- 8301 Mission Gorge Rd Unit 208
- 8301 Mission Gorge Rd Unit 282
- 8301 Mission Gorge Rd Unit 248
- 8301 Mission Gorge Rd Unit 325
- 8301 Mission Gorge Rd Unit 382
- 8301 Mission Gorge Rd Unit 351
- 8301 Mission Gorge Rd Unit 331
- 8410 Kreiner Way
- 8411 Rumson Dr
- 8417 Rumson Dr
- 8418 Kreiner Way
- 9462 Kaschube Way
- 9468 Kaschube Way
- 8403 Kreiner Way
- 8423 Rumson Dr
- 9456 Kaschube Way
- 8411 Kreiner Way
- 8426 Kreiner Way
- 9474 Kaschube Way
- 9450 Kaschube Way
- 8419 Kreiner Way
- 8429 Rumson Dr
- 9435 Kaschube Way
- 9444 Kaschube Way
- 8434 Kreiner Way
- 8449 Amino Dr
- 8427 Kreiner Way