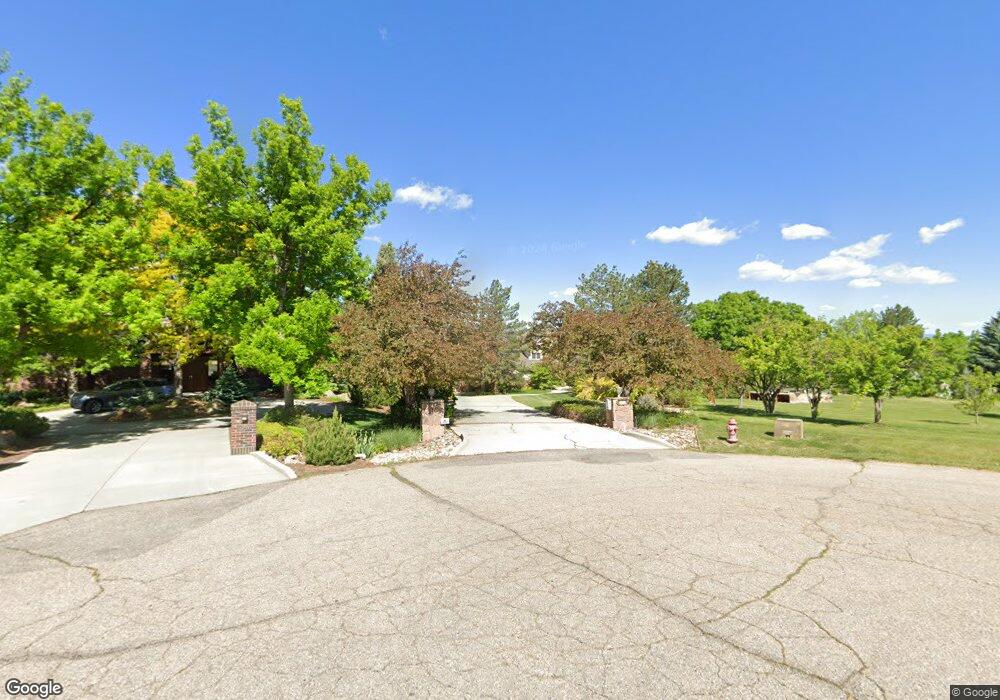
8403 Firethorn Ct Niwot, CO 80503
Niwot NeighborhoodEstimated Value: $1,962,000 - $2,732,000
4
Beds
5
Baths
4,641
Sq Ft
$513/Sq Ft
Est. Value
About This Home
This home is located at 8403 Firethorn Ct, Niwot, CO 80503 and is currently estimated at $2,381,019, approximately $513 per square foot. 8403 Firethorn Ct is a home located in Boulder County with nearby schools including Niwot Elementary School, Sunset Middle School, and Niwot High School.
Ownership History
Date
Name
Owned For
Owner Type
Purchase Details
Closed on
Mar 11, 2021
Sold by
Riegel David L and Riegel Sharon L
Bought by
Riegel David L
Current Estimated Value
Purchase Details
Closed on
Feb 20, 2012
Sold by
Riegel David L and Riegel Sharon L
Bought by
Riegel David L
Purchase Details
Closed on
Oct 27, 1993
Sold by
Riegel David L and Riegel Sharon L
Bought by
Riegel David L
Home Financials for this Owner
Home Financials are based on the most recent Mortgage that was taken out on this home.
Original Mortgage
$203,150
Interest Rate
6.96%
Purchase Details
Closed on
Mar 1, 1993
Bought by
Riegel David L and Riegel Sharon L
Purchase Details
Closed on
Dec 20, 1990
Bought by
Riegel David L and Riegel Sharon L
Purchase Details
Closed on
Jun 4, 1990
Bought by
Riegel David L and Riegel Sharon L
Create a Home Valuation Report for This Property
The Home Valuation Report is an in-depth analysis detailing your home's value as well as a comparison with similar homes in the area
Home Values in the Area
Average Home Value in this Area
Purchase History
| Date | Buyer | Sale Price | Title Company |
|---|---|---|---|
| Riegel David L | -- | None Available | |
| Riegel David L | -- | None Available | |
| Riegel David L | -- | Commonwealth Land Title Ins | |
| Riegel David L | -- | -- | |
| Riegel David L | $618,000 | -- | |
| Riegel David L | $165,900 | -- |
Source: Public Records
Mortgage History
| Date | Status | Borrower | Loan Amount |
|---|---|---|---|
| Closed | Riegel David L | $203,150 |
Source: Public Records
Tax History Compared to Growth
Tax History
| Year | Tax Paid | Tax Assessment Tax Assessment Total Assessment is a certain percentage of the fair market value that is determined by local assessors to be the total taxable value of land and additions on the property. | Land | Improvement |
|---|---|---|---|---|
| 2025 | $14,464 | $152,207 | $51,694 | $100,513 |
| 2024 | $14,464 | $152,207 | $51,694 | $100,513 |
| 2023 | $14,272 | $153,993 | $47,805 | $109,873 |
| 2022 | $11,132 | $116,537 | $42,909 | $73,628 |
| 2021 | $11,279 | $119,891 | $44,144 | $75,747 |
| 2020 | $10,564 | $113,027 | $47,333 | $65,694 |
| 2019 | $10,531 | $113,027 | $47,333 | $65,694 |
| 2018 | $9,130 | $99,698 | $45,144 | $54,554 |
| 2017 | $8,574 | $110,222 | $49,909 | $60,313 |
| 2016 | $8,343 | $96,085 | $51,979 | $44,106 |
| 2015 | $7,946 | $87,560 | $18,626 | $68,934 |
| 2014 | $8,120 | $87,560 | $18,626 | $68,934 |
Source: Public Records
Map
Nearby Homes
- 6482 Cherry Ct
- 8400 Sawtooth Ln
- 6816 Goldbranch Dr
- 6851 Goldbranch Dr
- 8748 Skyland Dr
- 8536 Foxhaven Ct
- 7999 Centrebridge Dr
- 8568 Foxhaven Dr
- 8060 Niwot Rd Unit 34
- 6668 Walker Ct
- 8050 Niwot Rd Unit 28
- 8050 Niwot Rd Unit 37
- 8050 Niwot Rd Unit 31
- 8050 Niwot Rd Unit 40
- 8836 Marathon Rd
- 8911 Little Raven Trail
- 6423 Monarch Park Ct
- 6541 Legend Ridge Trail
- 8009 James Ct
- 7970 James Ct
- 8414 Firethorn Ct
- 8324 Greenwood Dr
- 8316 Greenwood Dr
- 8277 Cattail Dr
- 8312 Greenwood Dr
- 8336 Greenwood Dr
- 8425 Firethorn Ct
- 8261 Cattail Dr
- 8293 Cattail Dr
- 8300 Greenwood Dr
- 8428 Firethorn Ct
- 8315 Greenwood Dr
- 8340 Greenwood Dr
- 8272 Greenwood Place
- 8406 Greenwood Dr
- 8343 Greenwood Dr
- 8449 Firethorn Ct
- 8259 Cattail Dr
- 8274 Cattail Dr
- 8452 Firethorn Ct