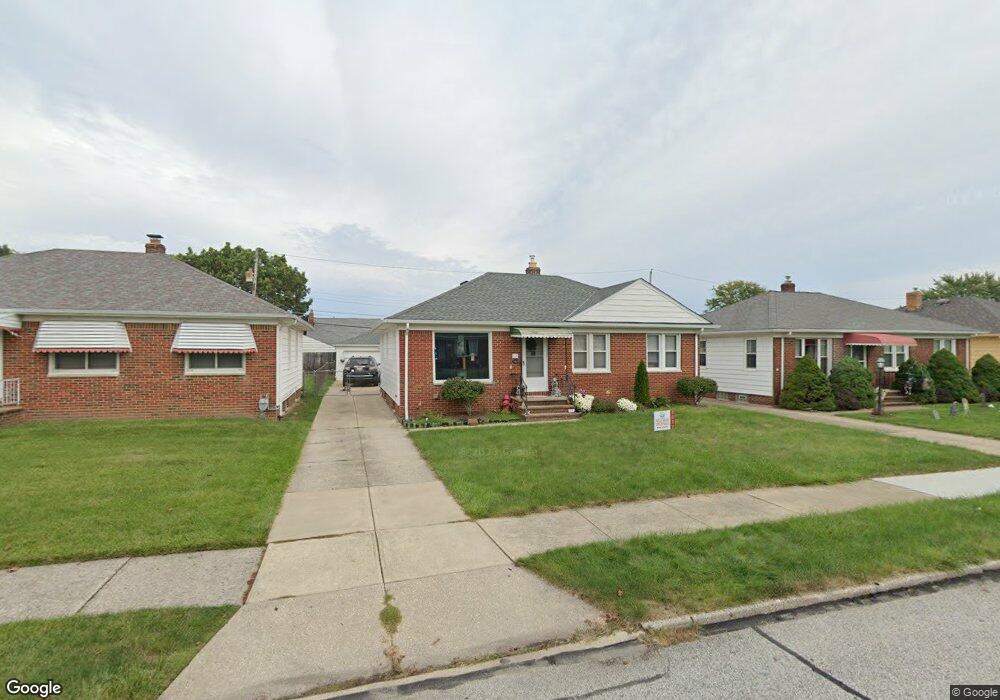
8404 Lanyard Dr Cleveland, OH 44129
Estimated Value: $205,919 - $229,000
3
Beds
1
Bath
1,064
Sq Ft
$204/Sq Ft
Est. Value
About This Home
This home is located at 8404 Lanyard Dr, Cleveland, OH 44129 and is currently estimated at $216,730, approximately $203 per square foot. 8404 Lanyard Dr is a home located in Cuyahoga County with nearby schools including Renwood Elementary School, Thoreau Park Elementary School, and Greenbriar Middle School.
Ownership History
Date
Name
Owned For
Owner Type
Purchase Details
Closed on
Apr 10, 2007
Sold by
Bendzak Mary H
Bought by
Wagner Jeffrey A
Current Estimated Value
Home Financials for this Owner
Home Financials are based on the most recent Mortgage that was taken out on this home.
Original Mortgage
$109,000
Outstanding Balance
$66,085
Interest Rate
6.2%
Mortgage Type
Purchase Money Mortgage
Estimated Equity
$150,645
Purchase Details
Closed on
May 9, 2001
Sold by
Bendzak Mary H
Bought by
Bendzak Mary H
Purchase Details
Closed on
Nov 26, 1999
Sold by
Mizak Robert
Bought by
Bendzak Mary H
Purchase Details
Closed on
Aug 14, 1981
Sold by
Mizak Mary C
Bought by
Mizak Mary C Trs
Purchase Details
Closed on
Apr 29, 1981
Sold by
Mizak Andrew J and Mizak Mary
Bought by
Mizak Mary C
Purchase Details
Closed on
Jan 1, 1975
Bought by
Mizak Andrew J and Mizak Mary
Create a Home Valuation Report for This Property
The Home Valuation Report is an in-depth analysis detailing your home's value as well as a comparison with similar homes in the area
Home Values in the Area
Average Home Value in this Area
Purchase History
| Date | Buyer | Sale Price | Title Company |
|---|---|---|---|
| Wagner Jeffrey A | $119,000 | City Title Agency | |
| Bendzak Mary H | -- | -- | |
| Bendzak Mary H | $73,000 | City Title Company Agency In | |
| Mizak Mary C Trs | -- | -- | |
| Mizak Mary C | -- | -- | |
| Mizak Andrew J | -- | -- |
Source: Public Records
Mortgage History
| Date | Status | Borrower | Loan Amount |
|---|---|---|---|
| Open | Wagner Jeffrey A | $109,000 |
Source: Public Records
Tax History Compared to Growth
Tax History
| Year | Tax Paid | Tax Assessment Tax Assessment Total Assessment is a certain percentage of the fair market value that is determined by local assessors to be the total taxable value of land and additions on the property. | Land | Improvement |
|---|---|---|---|---|
| 2024 | $3,806 | $62,475 | $11,830 | $50,645 |
| 2023 | $3,570 | $50,650 | $10,470 | $40,180 |
| 2022 | $3,537 | $50,650 | $10,470 | $40,180 |
| 2021 | $3,640 | $50,650 | $10,470 | $40,180 |
| 2020 | $3,184 | $38,960 | $8,050 | $30,910 |
| 2019 | $3,055 | $111,300 | $23,000 | $88,300 |
| 2018 | $3,074 | $38,960 | $8,050 | $30,910 |
| 2017 | $2,971 | $35,150 | $6,900 | $28,250 |
| 2016 | $2,953 | $35,150 | $6,900 | $28,250 |
| 2015 | $2,848 | $35,150 | $6,900 | $28,250 |
| 2014 | $2,848 | $35,850 | $7,040 | $28,810 |
Source: Public Records
Map
Nearby Homes
- 8514 Deerfield Dr
- 5972 Westminster Dr
- 8017 Wainstead Dr
- 5926 Deering Ave
- 8017 Ackley Rd
- 5906 Twin Lakes Dr
- 6111 Denison Blvd
- 7503 Whittington Dr
- 6136 Ridge Rd
- 5860 Pearl Rd
- 8314 Oxford Dr
- 7514 Spring Garden Rd
- 6227 Ridge Rd
- 6168 Manchester Rd
- 6234 N Canterbury Rd
- 7615 Bertha Ave
- 6111 Manchester Rd
- 8218 Covington Ave
- 6413 Alderwood Rd
- 6298 Chestnut Hills Dr
- 8410 Lanyard Dr
- 8324 Lanyard Dr
- 8414 Lanyard Dr
- 8322 Lanyard Dr
- 8407 Deerfield Dr
- 8403 Deerfield Dr
- 8502 Lanyard Dr
- 8411 Deerfield Dr
- 8327 Deerfield Dr
- 8318 Lanyard Dr
- 8415 Deerfield Dr
- 8323 Deerfield Dr
- 8403 Lanyard Dr
- 8506 Lanyard Dr
- 8503 Deerfield Dr
- 8325 Lanyard Dr
- 8415 Lanyard Dr
- 8314 Lanyard Dr
- 8319 Deerfield Dr
- 8321 Lanyard Dr