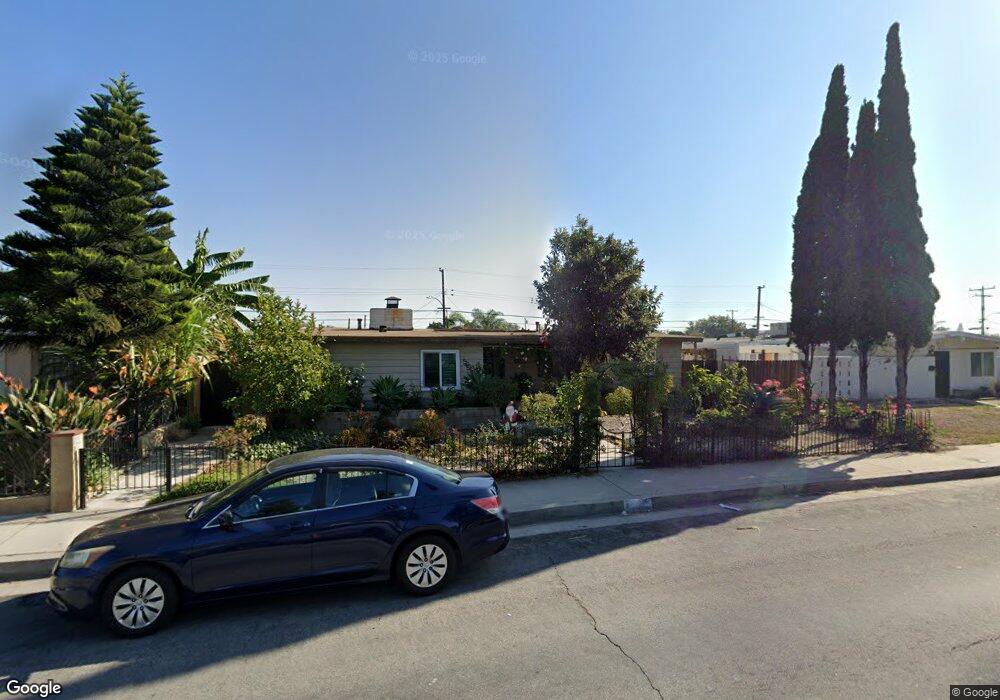
8404 Stanton Ave Buena Park, CA 90620
Estimated Value: $889,000 - $923,990
3
Beds
2
Baths
1,763
Sq Ft
$515/Sq Ft
Est. Value
About This Home
This home is located at 8404 Stanton Ave, Buena Park, CA 90620 and is currently estimated at $908,498, approximately $515 per square foot. 8404 Stanton Ave is a home located in Orange County with nearby schools including Glen H. Dysinger Sr. Elementary School, Dale Jr High School, and Savanna High School.
Ownership History
Date
Name
Owned For
Owner Type
Purchase Details
Closed on
Nov 13, 2001
Sold by
Mata Rodolfo A and Mata Zenaida
Bought by
Utecht Andrew
Current Estimated Value
Home Financials for this Owner
Home Financials are based on the most recent Mortgage that was taken out on this home.
Original Mortgage
$223,198
Outstanding Balance
$86,272
Interest Rate
6.57%
Estimated Equity
$822,226
Purchase Details
Closed on
Sep 22, 1999
Sold by
David Cecile F and David Cecile F
Bought by
Mata Rodolfo A
Home Financials for this Owner
Home Financials are based on the most recent Mortgage that was taken out on this home.
Original Mortgage
$180,471
Interest Rate
7.77%
Mortgage Type
FHA
Purchase Details
Closed on
Jul 15, 1999
Sold by
Mcdonnell Dennis
Bought by
Mcdonnell Cecile F
Create a Home Valuation Report for This Property
The Home Valuation Report is an in-depth analysis detailing your home's value as well as a comparison with similar homes in the area
Home Values in the Area
Average Home Value in this Area
Purchase History
| Date | Buyer | Sale Price | Title Company |
|---|---|---|---|
| Utecht Andrew | $230,000 | Lawyers Title Company | |
| Mata Rodolfo A | $182,000 | Chicago Title Co | |
| Mcdonnell Cecile F | -- | Chicago Title Co |
Source: Public Records
Mortgage History
| Date | Status | Borrower | Loan Amount |
|---|---|---|---|
| Open | Utecht Andrew | $223,198 | |
| Previous Owner | Mata Rodolfo A | $180,471 |
Source: Public Records
Tax History Compared to Growth
Tax History
| Year | Tax Paid | Tax Assessment Tax Assessment Total Assessment is a certain percentage of the fair market value that is determined by local assessors to be the total taxable value of land and additions on the property. | Land | Improvement |
|---|---|---|---|---|
| 2025 | $4,452 | $381,281 | $266,395 | $114,886 |
| 2024 | $4,452 | $373,805 | $261,171 | $112,634 |
| 2023 | $4,340 | $366,476 | $256,050 | $110,426 |
| 2022 | $4,283 | $359,291 | $251,030 | $108,261 |
| 2021 | $4,221 | $352,247 | $246,108 | $106,139 |
| 2020 | $4,196 | $348,636 | $243,585 | $105,051 |
| 2019 | $4,092 | $341,800 | $238,808 | $102,992 |
| 2018 | $4,017 | $335,099 | $234,126 | $100,973 |
| 2017 | $3,891 | $328,529 | $229,535 | $98,994 |
| 2016 | $3,817 | $322,088 | $225,035 | $97,053 |
| 2015 | $3,773 | $317,250 | $221,654 | $95,596 |
| 2014 | $3,585 | $311,036 | $217,312 | $93,724 |
Source: Public Records
Map
Nearby Homes
- 8452 Stanton Ave
- 7720 Crescent Ave
- 7950 Jackson Way
- 3053 W Coolidge Ave
- 2955 W Lincoln Ave Unit 7
- 8319 Hickory Dr
- 7545 Jackson Way
- 2871 W Tyler Ave
- 2943 W Lincoln Ave
- 3131 W Polk Ave
- 109 S Laxore St
- Plan Two at Mason
- Plan Four at Mason
- Plan Three at Mason
- Plan Seven at Mason
- 8434 Periwinkle Dr
- 103 S Laxore St
- 106 S Laxore St Unit 407
- 107 S Laxore St
- 21 Centerstone Cir
- 8392 Stanton Ave
- 8416 Stanton Ave
- 8397 Mulberry Ave
- 8380 Stanton Ave
- 8428 Stanton Ave
- 8409 Mulberry Ave
- 8385 Mulberry Ave
- 8421 Mulberry Ave
- 8375 Mulberry Ave
- 8368 Stanton Ave
- 8440 Stanton Ave
- 8433 Mulberry Ave
- 8365 Mulberry Ave
- 8356 Stanton Ave
- 8445 Mulberry Ave
- 8408 Mulberry Ave
- 8394 Mulberry Ave
- 8353 Mulberry Ave
- 8420 Mulberry Ave
- 8380 Mulberry Ave