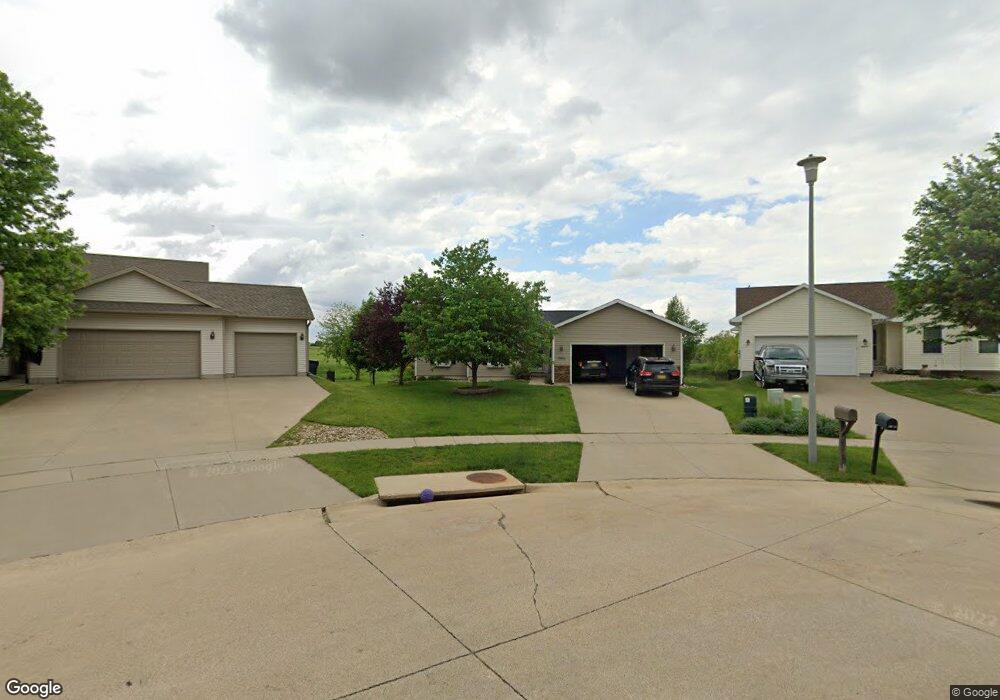
8406 Brighton Ct SW Cedar Rapids, IA 52404
Estimated Value: $243,000 - $348,000
4
Beds
4
Baths
1,272
Sq Ft
$247/Sq Ft
Est. Value
About This Home
This home is located at 8406 Brighton Ct SW, Cedar Rapids, IA 52404 and is currently estimated at $313,721, approximately $246 per square foot. 8406 Brighton Ct SW is a home located in Linn County with nearby schools including Prairie Ridge Elementary School, Prairie Heights Elementary School, and Prairie View Elementary School.
Ownership History
Date
Name
Owned For
Owner Type
Purchase Details
Closed on
May 1, 2015
Sold by
Miller Matthew D and Miller Heidi M
Bought by
Kniffen David T and Kniffen Jama R
Current Estimated Value
Home Financials for this Owner
Home Financials are based on the most recent Mortgage that was taken out on this home.
Original Mortgage
$150,000
Outstanding Balance
$115,555
Interest Rate
3.68%
Mortgage Type
New Conventional
Estimated Equity
$198,166
Purchase Details
Closed on
Jun 8, 2007
Sold by
Cjs Cedar Ridge Development Inc
Bought by
Miller Matthew D and Miller Heidi M
Create a Home Valuation Report for This Property
The Home Valuation Report is an in-depth analysis detailing your home's value as well as a comparison with similar homes in the area
Home Values in the Area
Average Home Value in this Area
Purchase History
| Date | Buyer | Sale Price | Title Company |
|---|---|---|---|
| Kniffen David T | $212,500 | None Available | |
| Miller Matthew D | $48,000 | None Available |
Source: Public Records
Mortgage History
| Date | Status | Borrower | Loan Amount |
|---|---|---|---|
| Open | Kniffen David T | $150,000 |
Source: Public Records
Tax History Compared to Growth
Tax History
| Year | Tax Paid | Tax Assessment Tax Assessment Total Assessment is a certain percentage of the fair market value that is determined by local assessors to be the total taxable value of land and additions on the property. | Land | Improvement |
|---|---|---|---|---|
| 2025 | $5,170 | $333,200 | $66,400 | $266,800 |
| 2024 | $5,504 | $283,300 | $66,400 | $216,900 |
| 2023 | $5,504 | $283,300 | $66,400 | $216,900 |
| 2022 | $5,086 | $257,300 | $57,200 | $200,100 |
| 2021 | $5,016 | $243,000 | $57,200 | $185,800 |
| 2020 | $5,016 | $228,900 | $57,200 | $171,700 |
| 2019 | $4,506 | $209,400 | $47,900 | $161,500 |
| 2018 | $4,378 | $209,400 | $47,900 | $161,500 |
| 2017 | $4,444 | $206,000 | $51,600 | $154,400 |
| 2016 | $4,343 | $200,700 | $51,600 | $149,100 |
| 2015 | $4,285 | $199,104 | $51,623 | $147,481 |
| 2014 | $4,098 | $199,104 | $51,623 | $147,481 |
| 2013 | $3,890 | $199,104 | $51,623 | $147,481 |
Source: Public Records
Map
Nearby Homes
- 142 Brighton Cir SW
- 137 Woodstone Ln SW
- 107 Woodstone Ln SW
- 160 Bethany Loop SW Unit A
- 160 Bethany Loop SW Unit C
- 160 Bethany Loop SW Unit B
- 163 Bethany Loop SW Unit A
- 163 Bethany Loop SW Unit B
- 8704 Eddie Dr SW Unit B
- 8705 Lewis Dr SW Unit C
- 8704 Eddie Dr SW Unit A
- 8704 Eddie Dr SW Unit C
- 8705 Lewis Dr SW Unit B
- 8705 Lewis Dr SW Unit A
- 8921 SW Griswold Ln
- 8921 SW Griswold Ln Unit Lot 20
- 110 SW Audrey Way Unit Lot 11
- 110 SW Audrey Way
- 8927 SW Griswold Ln Unit Lot 21
- 8927 SW Griswold Ln
- 8404 Brighton Ct SW
- 8410 Brighton Ct SW
- 8404 Brighton Ct SW
- 8412 Brighton Ct SW
- 8403 Brighton Ct SW
- 8416 Brighton Ct SW
- 8418 Brighton Ct SW
- 8405 Brighton Ct SW
- 8405 Brighton Ct SW
- 8409 Brighton Ct SW
- 8409 Brighton Ct SW
- 158 Brighton Cir SW
- 8415 Brighton Ct SW
- 8411 Brighton Ct SW
- 8424 Aldridge Dr SW
- 8417 Brighton Ct SW
- 8428 Aldridge Dr SW
- 8432 Aldridge Dr SW
- 155 Brighton Cir SW
- 155 Brighton Cirlce SW