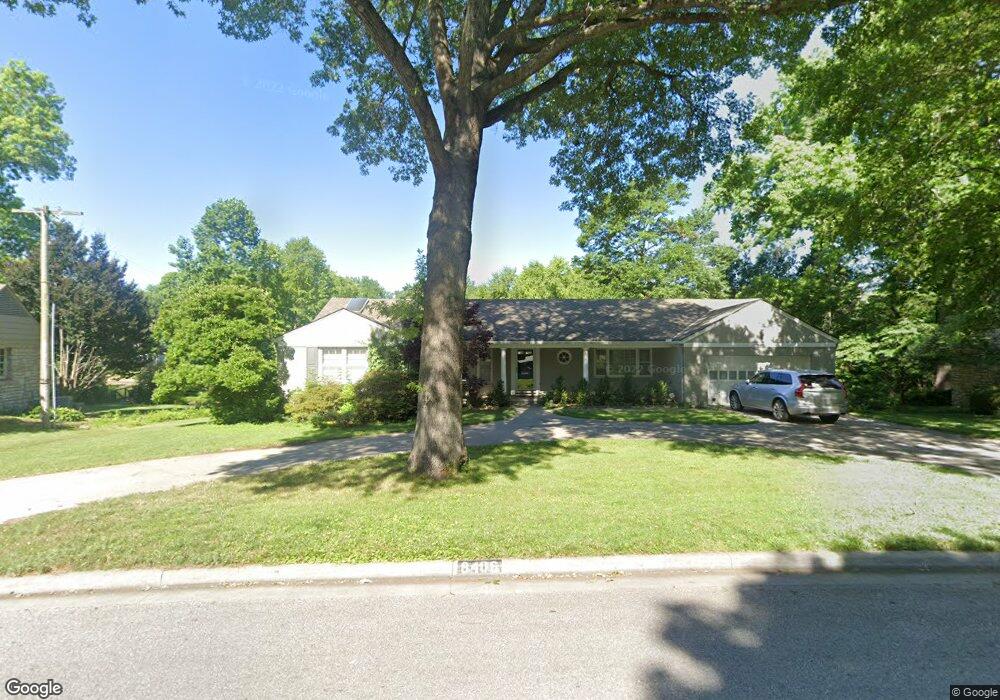
8406 Ensley Ln Leawood, KS 66206
Estimated Value: $959,000 - $1,257,000
3
Beds
3
Baths
2,508
Sq Ft
$426/Sq Ft
Est. Value
About This Home
This home is located at 8406 Ensley Ln, Leawood, KS 66206 and is currently estimated at $1,067,659, approximately $425 per square foot. 8406 Ensley Ln is a home located in Johnson County with nearby schools including Indian Hills Middle School, Shawnee Mission East High School, and Highlawn Montessori School.
Ownership History
Date
Name
Owned For
Owner Type
Purchase Details
Closed on
Jun 29, 2016
Sold by
Quick Jennifer A
Bought by
Quick William E
Current Estimated Value
Purchase Details
Closed on
Jun 21, 2013
Sold by
Craig L Eileen and Craig Lula Eileen
Bought by
Quick William E and Quick Jennifer A
Home Financials for this Owner
Home Financials are based on the most recent Mortgage that was taken out on this home.
Original Mortgage
$64,500
Interest Rate
2.74%
Mortgage Type
Stand Alone Second
Purchase Details
Closed on
Aug 29, 2002
Sold by
Craig L Eileen and Eileen Karlson L
Bought by
Craig L Eileen and Craig Lula Eileen
Home Financials for this Owner
Home Financials are based on the most recent Mortgage that was taken out on this home.
Original Mortgage
$100,000
Interest Rate
6.41%
Create a Home Valuation Report for This Property
The Home Valuation Report is an in-depth analysis detailing your home's value as well as a comparison with similar homes in the area
Home Values in the Area
Average Home Value in this Area
Purchase History
| Date | Buyer | Sale Price | Title Company |
|---|---|---|---|
| Quick William E | -- | None Available | |
| Quick William E | -- | Chicago Title Co Llc | |
| Craig L Eileen | -- | Stewart Title Inc |
Source: Public Records
Mortgage History
| Date | Status | Borrower | Loan Amount |
|---|---|---|---|
| Previous Owner | Quick William E | $64,500 | |
| Previous Owner | Quick William E | $417,000 | |
| Previous Owner | Craig L Eileen | $100,000 | |
| Closed | Craig L Eileen | $66,848 |
Source: Public Records
Tax History Compared to Growth
Tax History
| Year | Tax Paid | Tax Assessment Tax Assessment Total Assessment is a certain percentage of the fair market value that is determined by local assessors to be the total taxable value of land and additions on the property. | Land | Improvement |
|---|---|---|---|---|
| 2024 | $12,311 | $114,954 | $58,768 | $56,186 |
| 2023 | $11,814 | $109,963 | $53,421 | $56,542 |
| 2022 | $9,538 | $89,010 | $48,550 | $40,460 |
| 2021 | $9,381 | $84,226 | $48,550 | $35,676 |
| 2020 | $8,663 | $76,670 | $44,132 | $32,538 |
| 2019 | $8,409 | $74,612 | $36,767 | $37,845 |
| 2018 | $8,128 | $71,875 | $36,767 | $35,108 |
| 2017 | $7,843 | $68,287 | $28,287 | $40,000 |
| 2016 | $7,713 | $66,298 | $21,764 | $44,534 |
| 2015 | $7,347 | $63,664 | $21,764 | $41,900 |
| 2013 | -- | $62,112 | $18,129 | $43,983 |
Source: Public Records
Map
Nearby Homes
- 8324 Meadow Ln
- 8514 Belinder Rd
- 3004 W 83rd Terrace
- 8228 Ensley Ln
- 8429 Meadow Ln
- 2815 W 82nd St
- 2816 W 87th Terrace
- 8700 Lee Blvd
- 8605 Reinhardt Ln
- 8600 Sagamore Rd
- 8020 Meadow Ln
- 3615 W 83rd Terrace
- 2110 W 86th St
- 2108 W 86th St
- 2106 W 86th St
- 2104 W 86th St
- 2102 W 86th St
- 8728 Cherokee Ln
- 8005 Ensley Ln
- 2508 W 88th St
- 8410 Ensley Ln
- 8400 Ensley Ln
- 8407 Ensley Ln
- 8401 Ensley Ln
- 8411 Ensley Ln
- 8416 Ensley Ln
- 8336 Ensley Ln
- 8415 Cherokee Ln
- 8333 Ensley Ln
- 8417 Ensley Ln
- 8417 Cherokee Ln
- 8311 Cherokee Ln
- 8406 Belinder Rd
- 8410 Belinder Rd
- 8409 Cherokee Ln
- 8420 Ensley Ln
- 8400 Belinder Rd
- 8332 Ensley Ln
- 8416 Belinder Rd
- 8419 Cherokee Ln