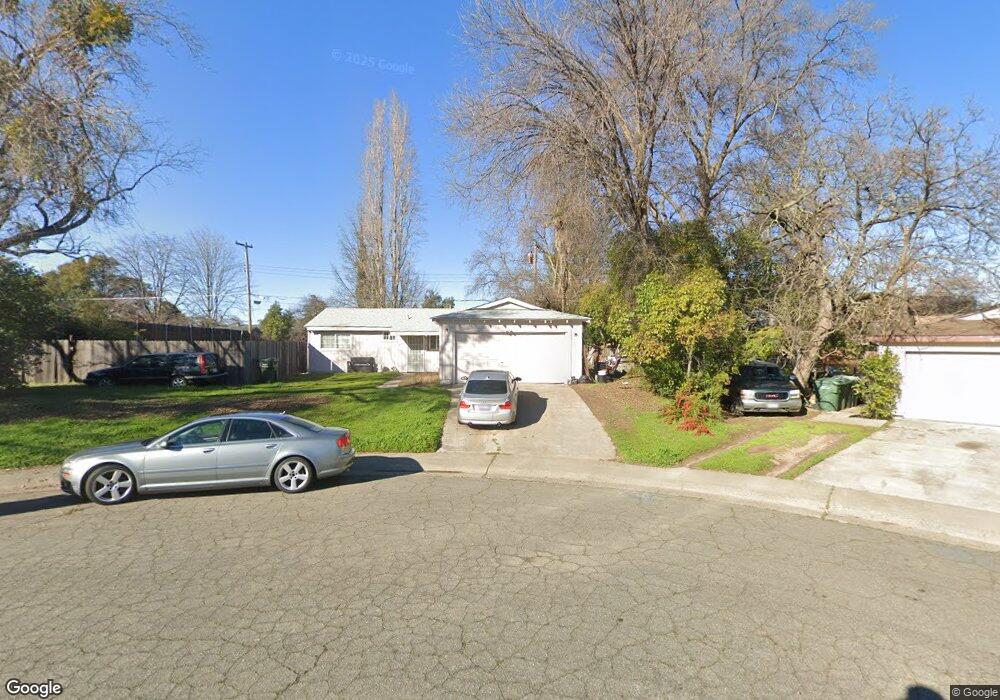
8407 Taramore Ct Orangevale, CA 95662
Estimated Value: $417,469 - $439,000
3
Beds
1
Bath
984
Sq Ft
$433/Sq Ft
Est. Value
About This Home
This home is located at 8407 Taramore Ct, Orangevale, CA 95662 and is currently estimated at $425,617, approximately $432 per square foot. 8407 Taramore Ct is a home located in Sacramento County with nearby schools including Trajan Elementary School, Louis Pasteur Fundamental Middle School, and Casa Roble Fundamental High School.
Ownership History
Date
Name
Owned For
Owner Type
Purchase Details
Closed on
May 18, 2011
Sold by
Molteni Mary
Bought by
Brock Matt
Current Estimated Value
Home Financials for this Owner
Home Financials are based on the most recent Mortgage that was taken out on this home.
Original Mortgage
$103,525
Outstanding Balance
$71,912
Interest Rate
4.87%
Mortgage Type
FHA
Estimated Equity
$353,705
Purchase Details
Closed on
Dec 12, 2008
Sold by
Morris John and Morris Lisa
Bought by
Molteni Mary
Home Financials for this Owner
Home Financials are based on the most recent Mortgage that was taken out on this home.
Original Mortgage
$192,262
Interest Rate
6.16%
Mortgage Type
FHA
Purchase Details
Closed on
Jun 26, 1995
Sold by
Watts Leonard D and Watts Jeannette L
Bought by
Morris John and Morris Lisa
Create a Home Valuation Report for This Property
The Home Valuation Report is an in-depth analysis detailing your home's value as well as a comparison with similar homes in the area
Home Values in the Area
Average Home Value in this Area
Purchase History
| Date | Buyer | Sale Price | Title Company |
|---|---|---|---|
| Brock Matt | $115,000 | Fidelity National Title Co | |
| Molteni Mary | $194,500 | First American Title Company | |
| Morris John | -- | -- |
Source: Public Records
Mortgage History
| Date | Status | Borrower | Loan Amount |
|---|---|---|---|
| Open | Brock Matt | $103,525 | |
| Previous Owner | Molteni Mary | $192,262 |
Source: Public Records
Tax History
| Year | Tax Paid | Tax Assessment Tax Assessment Total Assessment is a certain percentage of the fair market value that is determined by local assessors to be the total taxable value of land and additions on the property. | Land | Improvement |
|---|---|---|---|---|
| 2025 | $1,704 | $147,323 | $89,675 | $57,648 |
| 2024 | $1,704 | $144,435 | $87,917 | $56,518 |
| 2023 | $1,660 | $141,604 | $86,194 | $55,410 |
| 2022 | $1,650 | $138,828 | $84,504 | $54,324 |
| 2021 | $1,622 | $136,107 | $82,848 | $53,259 |
| 2020 | $1,592 | $134,712 | $81,999 | $52,713 |
| 2019 | $1,559 | $132,072 | $80,392 | $51,680 |
| 2018 | $1,536 | $129,483 | $78,816 | $50,667 |
| 2017 | $1,524 | $126,945 | $77,271 | $49,674 |
| 2016 | $1,425 | $124,456 | $75,756 | $48,700 |
| 2015 | $1,401 | $122,588 | $74,619 | $47,969 |
| 2014 | $1,371 | $120,188 | $73,158 | $47,030 |
Source: Public Records
Map
Nearby Homes
- 8301 Central Ave
- 8442 Cobble Creek Ln
- 8437 Cobble Creek Ln
- 8384 Old Ranch Rd
- 8445 Juglans Dr
- 8272 Woodlake Hills Dr
- 8265 Northwind Way
- 8583 Central Ave
- 7001 Jenner Ct
- 8391 Cranford Way
- 8484 Oakwind Ct
- 8236 Crestshire Cir
- 8457 N Star Way
- 6219 Trajan Dr
- 6900 Almond Ave Unit 49
- 6900 Almond Ave Unit 99
- 6944 Woodmore Oaks Dr
- 8037 Ruthwood Way
- 6605 Thunderhead Cir
- 8641 Stratus Dr
- 8401 Taramore Ct
- 8410 Central Ave
- 8400 Central Ave
- 8420 Central Ave
- 8413 Taramore Ct
- 8428 Central Ave
- 8400 Taramore Ct
- 8418 Taramore Ct
- 8412 Taramore Ct
- 8392 Central Ave
- 6625 Smithhart St
- 6619 Smithhart St
- 6613 Smithhart St
- 8436 Central Ave
- 8407 Central Ave
- 6700 Smithhart St
- 8413 Central Ave
- 8386 Central Ave
- 8411 Woodmore Dr
- 6607 Smithhart St
Your Personal Tour Guide
Ask me questions while you tour the home.