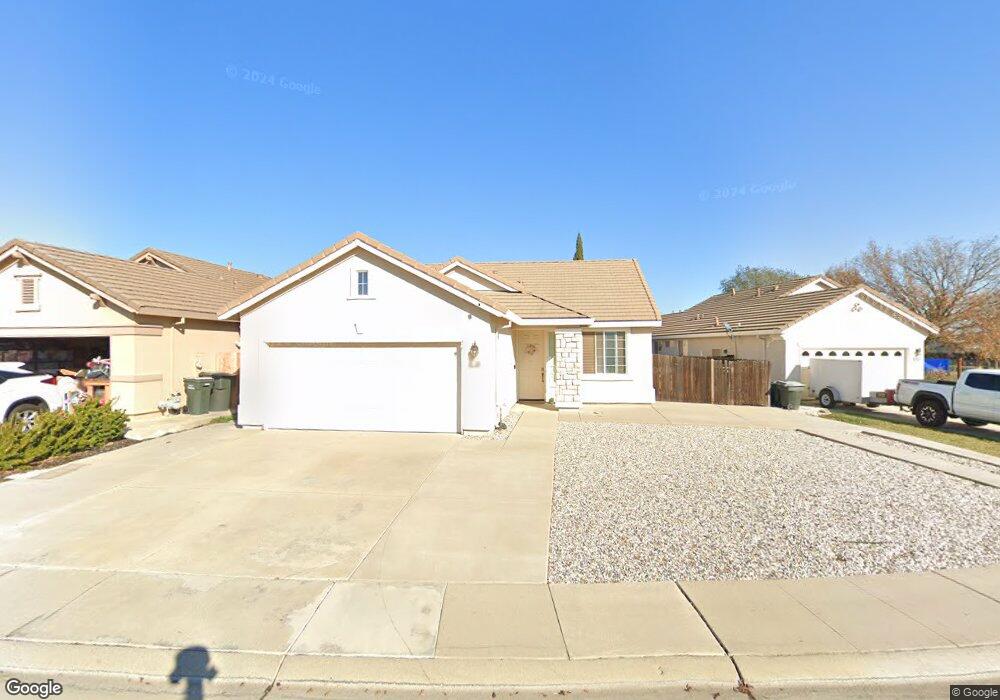
8408 Pinyon Pine Place Antelope, CA 95843
Estimated Value: $359,000 - $507,000
3
Beds
2
Baths
1,330
Sq Ft
$347/Sq Ft
Est. Value
About This Home
This home is located at 8408 Pinyon Pine Place, Antelope, CA 95843 and is currently estimated at $460,947, approximately $346 per square foot. 8408 Pinyon Pine Place is a home located in Sacramento County with nearby schools including Creekview Ranch, Antelope High School, and Antelope Christian Academy.
Ownership History
Date
Name
Owned For
Owner Type
Purchase Details
Closed on
Feb 10, 2011
Sold by
The Bank Of New York Mellon
Bought by
Aulakh Jagjeet S and Sangha Mandeep
Current Estimated Value
Home Financials for this Owner
Home Financials are based on the most recent Mortgage that was taken out on this home.
Original Mortgage
$156,550
Interest Rate
4.75%
Mortgage Type
FHA
Purchase Details
Closed on
Sep 27, 2010
Sold by
Mullican Jarvis G
Bought by
The Bank Of New York Mellon and The Bank Of New York
Purchase Details
Closed on
Apr 23, 2004
Sold by
Walker Chris
Bought by
Mullican Jarvis G
Home Financials for this Owner
Home Financials are based on the most recent Mortgage that was taken out on this home.
Original Mortgage
$228,000
Interest Rate
4.87%
Mortgage Type
New Conventional
Purchase Details
Closed on
Jan 18, 2002
Sold by
Beazer Homes Holdings Corp
Bought by
Walker Chris
Home Financials for this Owner
Home Financials are based on the most recent Mortgage that was taken out on this home.
Original Mortgage
$178,792
Interest Rate
7.17%
Mortgage Type
FHA
Create a Home Valuation Report for This Property
The Home Valuation Report is an in-depth analysis detailing your home's value as well as a comparison with similar homes in the area
Home Values in the Area
Average Home Value in this Area
Purchase History
| Date | Buyer | Sale Price | Title Company |
|---|---|---|---|
| Aulakh Jagjeet S | $166,000 | Landsafe Title | |
| The Bank Of New York Mellon | $171,000 | Landsafe Default | |
| Mullican Jarvis G | $285,000 | Alliance Title Company | |
| Mullican Jarvis G | -- | Alliance Title Company | |
| Walker Chris | $181,500 | Chicago Title Co |
Source: Public Records
Mortgage History
| Date | Status | Borrower | Loan Amount |
|---|---|---|---|
| Previous Owner | Aulakh Jagjeet S | $156,550 | |
| Previous Owner | Mullican Jarvis G | $228,000 | |
| Previous Owner | Walker Chris | $178,792 |
Source: Public Records
Tax History Compared to Growth
Tax History
| Year | Tax Paid | Tax Assessment Tax Assessment Total Assessment is a certain percentage of the fair market value that is determined by local assessors to be the total taxable value of land and additions on the property. | Land | Improvement |
|---|---|---|---|---|
| 2025 | $2,273 | $212,151 | $108,894 | $103,257 |
| 2024 | $2,273 | $207,992 | $106,759 | $101,233 |
| 2023 | $3,058 | $203,915 | $104,666 | $99,249 |
| 2022 | $3,035 | $199,917 | $102,614 | $97,303 |
| 2021 | $3,022 | $195,998 | $100,602 | $95,396 |
| 2020 | $2,982 | $193,989 | $99,571 | $94,418 |
| 2019 | $2,928 | $190,186 | $97,619 | $92,567 |
| 2018 | $2,829 | $186,457 | $95,705 | $90,752 |
| 2017 | $2,778 | $182,802 | $93,829 | $88,973 |
| 2016 | $2,704 | $179,219 | $91,990 | $87,229 |
| 2015 | $2,648 | $176,528 | $90,609 | $85,919 |
| 2014 | $2,596 | $173,071 | $88,835 | $84,236 |
Source: Public Records
Map
Nearby Homes
- 9620 Antelope Rd
- 8268 Ghislaine Way
- 0 Lewis Ave
- 9670 Canopy Tree St
- 3185 River Bank Ct
- 8344 Coven Hills Place
- 3113 Jenna Ct
- 7956 Brockwood Way
- 8008 Landmark Place
- 6301 Autumn Oak Ct
- 4924 Meadow Pass Way
- 8256 Yardgate Way
- 8069 Cornerstone Way
- 4923 Falconwood Ct
- 6112 Ledgewood Way
- 5947 Woodglade Ave
- 8400 Radford St
- 7633 Wood Duck Ln Unit 67
- 8568 Travary Way
- 5922 Cackler Ln Unit 83
- 8412 Pinyon Pine Place
- 8400 Pinyon Pine Place
- 8420 Pinyon Pine Place
- 5738 Great Valley Dr
- 8424 Pinyon Pine Place
- 5742 Great Valley Dr
- 8413 Pinyon Pine Place
- 8409 Pinyon Pine Place
- 8405 Pinyon Pine Place
- 8417 Pinyon Pine Place
- 8401 Pinyon Pine Place
- 8421 Pinyon Pine Place
- 5746 Great Valley Dr
- 8425 Pinyon Pine Place
- 5750 Great Valley Dr
- 8412 Sundrop Way
- 5754 Great Valley Dr
- 5745 Grey Birch Place
- 8416 Sundrop Way
- 8408 Sundrop Way