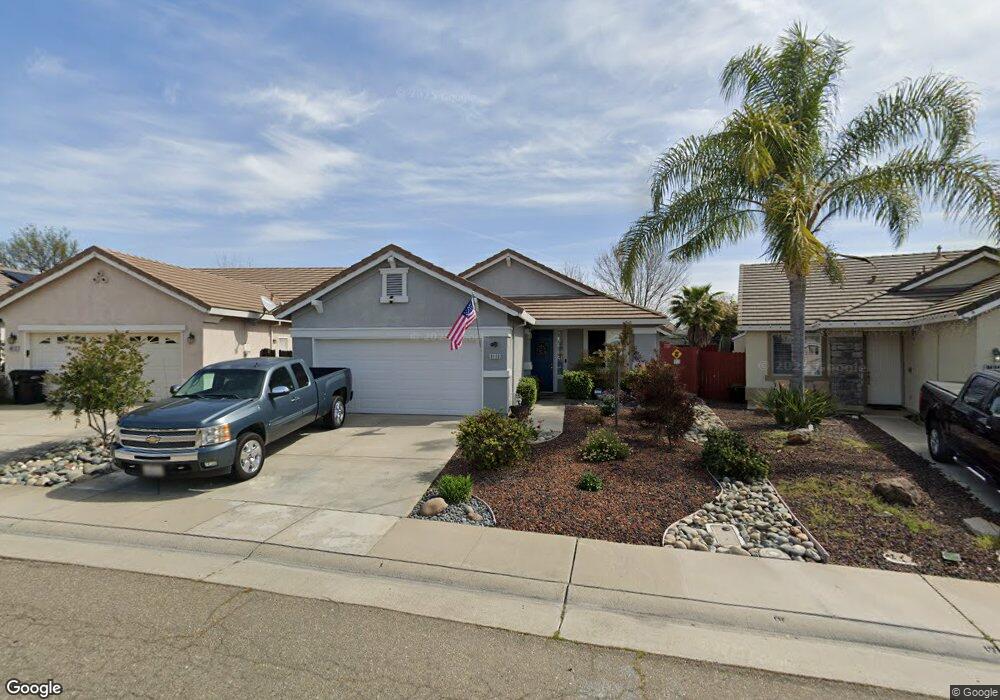
8408 Sundrop Way Antelope, CA 95843
Estimated Value: $438,000 - $472,757
3
Beds
2
Baths
1,165
Sq Ft
$393/Sq Ft
Est. Value
About This Home
This home is located at 8408 Sundrop Way, Antelope, CA 95843 and is currently estimated at $458,189, approximately $393 per square foot. 8408 Sundrop Way is a home located in Sacramento County with nearby schools including Creekview Ranch and Antelope High School.
Ownership History
Date
Name
Owned For
Owner Type
Purchase Details
Closed on
Feb 17, 2011
Sold by
The Bank Of New York Mellon
Bought by
Regpala Thomas
Current Estimated Value
Home Financials for this Owner
Home Financials are based on the most recent Mortgage that was taken out on this home.
Original Mortgage
$164,461
Outstanding Balance
$112,483
Interest Rate
4.77%
Mortgage Type
VA
Estimated Equity
$345,706
Purchase Details
Closed on
Sep 27, 2010
Sold by
Devore Sarah Anne and Devore Jeremy Robert
Bought by
The Bank Of New York Mellon and The Bank Of New York
Purchase Details
Closed on
Feb 14, 2002
Sold by
Beazer Homes Holdings Corp
Bought by
Devore Jeremy Robert and Devore Sarah Anne
Home Financials for this Owner
Home Financials are based on the most recent Mortgage that was taken out on this home.
Original Mortgage
$170,901
Interest Rate
6.99%
Mortgage Type
FHA
Create a Home Valuation Report for This Property
The Home Valuation Report is an in-depth analysis detailing your home's value as well as a comparison with similar homes in the area
Home Values in the Area
Average Home Value in this Area
Purchase History
| Date | Buyer | Sale Price | Title Company |
|---|---|---|---|
| Regpala Thomas | $161,000 | Landsafe Title | |
| The Bank Of New York Mellon | $159,750 | Landsafe Default | |
| Devore Jeremy Robert | $173,500 | Chicago Title Co |
Source: Public Records
Mortgage History
| Date | Status | Borrower | Loan Amount |
|---|---|---|---|
| Open | Regpala Thomas | $164,461 | |
| Previous Owner | Devore Jeremy Robert | $170,901 |
Source: Public Records
Tax History
| Year | Tax Paid | Tax Assessment Tax Assessment Total Assessment is a certain percentage of the fair market value that is determined by local assessors to be the total taxable value of land and additions on the property. | Land | Improvement |
|---|---|---|---|---|
| 2025 | $2,211 | $206,254 | $108,894 | $97,360 |
| 2024 | $2,211 | $202,210 | $106,759 | $95,451 |
| 2023 | $2,997 | $198,246 | $104,666 | $93,580 |
| 2022 | $2,974 | $194,360 | $102,614 | $91,746 |
| 2021 | $2,961 | $190,550 | $100,602 | $89,948 |
| 2020 | $2,921 | $188,597 | $99,571 | $89,026 |
| 2019 | $2,868 | $184,900 | $97,619 | $87,281 |
| 2018 | $2,771 | $181,275 | $95,705 | $85,570 |
| 2017 | $2,721 | $177,722 | $93,829 | $83,893 |
| 2016 | $2,648 | $174,239 | $91,990 | $82,249 |
| 2015 | $2,593 | $171,623 | $90,609 | $81,014 |
| 2014 | $2,542 | $168,263 | $88,835 | $79,428 |
Source: Public Records
Map
Nearby Homes
- 8341 Lewis Ave
- 5825 Blue Beech Ct
- 8500 Grey Iron Ct
- 8226 Windmill Oaks Place
- 8279 Ghislaine Way
- 8456 Cook Riolo Rd
- 5303 Elgin Hills Way
- 9670 Canopy Tree St
- 5751 Cerulean Hill Way
- 8019 Ivory Peak Way
- 8013 Ivory Peak Way
- 5815 Cerulean Hill Way
- 5763 Cerulean Hill Way
- 5818 Cerulean Hill Way
- 5747 Cerulean Hill Way
- 8936 Palmerson Dr
- 5131 Rosbury Dell Place
- 8605 Meandering Way
- 5971 Kylench Ct
- 6003 Kuvasz Ct
- 8404 Sundrop Way
- 8412 Sundrop Way
- 8416 Sundrop Way
- 8400 Sundrop Way
- 8409 Pinyon Pine Place
- 5741 Grey Birch Place
- 8413 Pinyon Pine Place
- 8420 Sundrop Way
- 8417 Pinyon Pine Place
- 8405 Pinyon Pine Place
- 8409 Sundrop Way
- 8401 Sundrop Way
- 5745 Grey Birch Place
- 8417 Sundrop Way
- 8421 Pinyon Pine Place
- 8424 Sundrop Way
- 8421 Sundrop Way
- 8425 Pinyon Pine Place
- 5732 Grey Birch Place
- 5736 Grey Birch Place
Your Personal Tour Guide
Ask me questions while you tour the home.