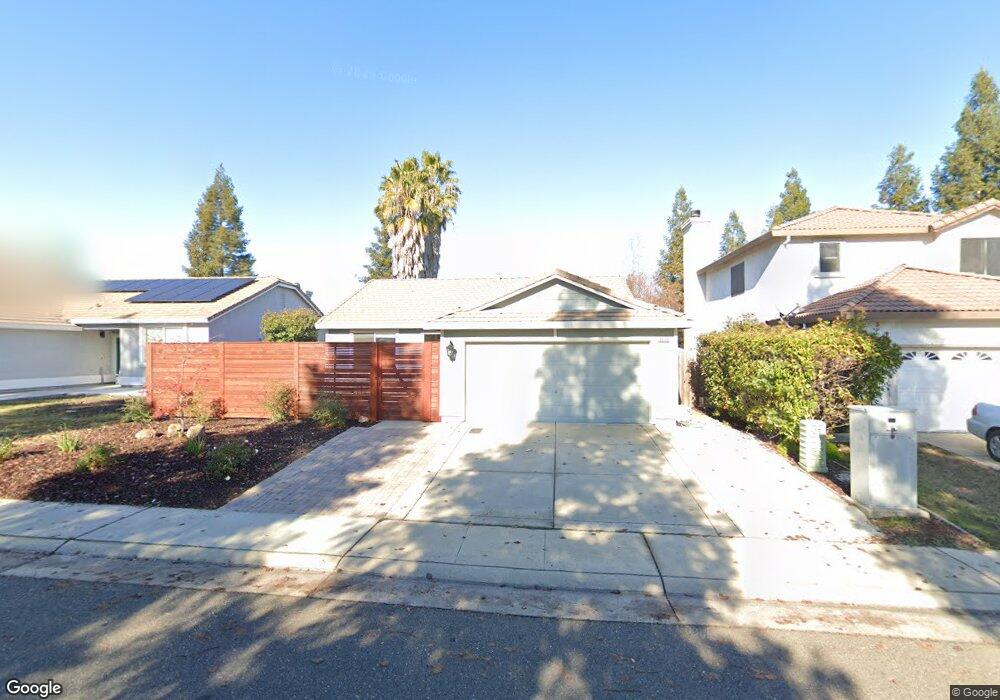
8409 Carriage Oaks Way Antelope, CA 95843
Estimated Value: $450,000 - $534,000
3
Beds
2
Baths
1,491
Sq Ft
$341/Sq Ft
Est. Value
About This Home
This home is located at 8409 Carriage Oaks Way, Antelope, CA 95843 and is currently estimated at $508,799, approximately $341 per square foot. 8409 Carriage Oaks Way is a home located in Sacramento County with nearby schools including Creekview Ranch, Antelope High School, and Antelope Christian Academy.
Ownership History
Date
Name
Owned For
Owner Type
Purchase Details
Closed on
Oct 6, 2005
Sold by
Martin Elizabeth and Martin Steven J
Bought by
Gutierrez Ruben R and Gutierrez Kymberly T
Current Estimated Value
Home Financials for this Owner
Home Financials are based on the most recent Mortgage that was taken out on this home.
Original Mortgage
$300,000
Outstanding Balance
$159,256
Interest Rate
5.63%
Mortgage Type
Fannie Mae Freddie Mac
Estimated Equity
$349,543
Purchase Details
Closed on
Jan 16, 2003
Sold by
Us Home Corp
Bought by
Lopes Elizabeth and Martin Steven J
Home Financials for this Owner
Home Financials are based on the most recent Mortgage that was taken out on this home.
Original Mortgage
$179,181
Interest Rate
5.97%
Purchase Details
Closed on
Aug 9, 2002
Sold by
Shf Properties Inc
Bought by
U S Home Corp
Create a Home Valuation Report for This Property
The Home Valuation Report is an in-depth analysis detailing your home's value as well as a comparison with similar homes in the area
Home Values in the Area
Average Home Value in this Area
Purchase History
| Date | Buyer | Sale Price | Title Company |
|---|---|---|---|
| Gutierrez Ruben R | $400,000 | North American Title Company | |
| Lopes Elizabeth | $224,000 | North American Title Co | |
| U S Home Corp | $217,000 | Stewart Title |
Source: Public Records
Mortgage History
| Date | Status | Borrower | Loan Amount |
|---|---|---|---|
| Open | Gutierrez Ruben R | $300,000 | |
| Previous Owner | Lopes Elizabeth | $179,181 |
Source: Public Records
Tax History Compared to Growth
Tax History
| Year | Tax Paid | Tax Assessment Tax Assessment Total Assessment is a certain percentage of the fair market value that is determined by local assessors to be the total taxable value of land and additions on the property. | Land | Improvement |
|---|---|---|---|---|
| 2025 | $5,723 | $526,000 | $115,000 | $411,000 |
| 2024 | $5,723 | $526,000 | $115,000 | $411,000 |
| 2023 | $6,112 | $482,000 | $115,000 | $367,000 |
| 2022 | $6,125 | $482,000 | $115,000 | $367,000 |
| 2021 | $6,221 | $480,483 | $180,181 | $300,302 |
| 2020 | $5,569 | $423,334 | $158,750 | $264,584 |
| 2019 | $5,302 | $399,373 | $149,765 | $249,608 |
| 2018 | $4,913 | $373,247 | $139,968 | $233,279 |
| 2017 | $4,500 | $336,260 | $126,098 | $210,162 |
| 2016 | $3,994 | $294,966 | $110,613 | $184,353 |
| 2015 | $3,667 | $268,152 | $100,558 | $167,594 |
| 2014 | $3,436 | $248,289 | $93,109 | $155,180 |
Source: Public Records
Map
Nearby Homes
- 8268 Ghislaine Way
- 0 Lewis Ave
- 9025 Palmerson Dr
- 9620 Antelope Rd
- 9670 Canopy Tree St
- 8344 Coven Hills Place
- 3185 River Bank Ct
- 8008 Landmark Place
- 4924 Meadow Pass Way
- 4923 Falconwood Ct
- 7956 Brockwood Way
- 6301 Autumn Oak Ct
- 3113 Jenna Ct
- 6112 Ledgewood Way
- 7633 Wood Duck Ln Unit 67
- 5921 Cackler Ln
- 7665 Copper Cove Place
- 8568 Travary Way
- 8038 Falcon View Dr
- 5922 Cackler Ln Unit 83
- 8405 Carriage Oaks Way
- 8413 Carriage Oaks Way
- 5650 Ridgepoint Dr
- 8401 Carriage Oaks Way
- 5646 Ridgepoint Dr
- 5654 Ridgepoint Dr
- 8237 Lewis Ave
- 5642 Ridgepoint Dr
- 8238 Windmill Oaks Place
- 8347 Carriage Oaks Way
- 5701 Cooper Mill Ct
- 8233 Lewis Ave
- 5638 Ridgepoint Dr
- 8234 Windmill Oaks Place
- 5700 Ridgepoint Dr
- 5700 Cooper Mill Ct
- 8343 Carriage Oaks Way
- 5705 Cooper Mill Ct
- 8229 Lewis Ave
- 8311 Lewis Ave