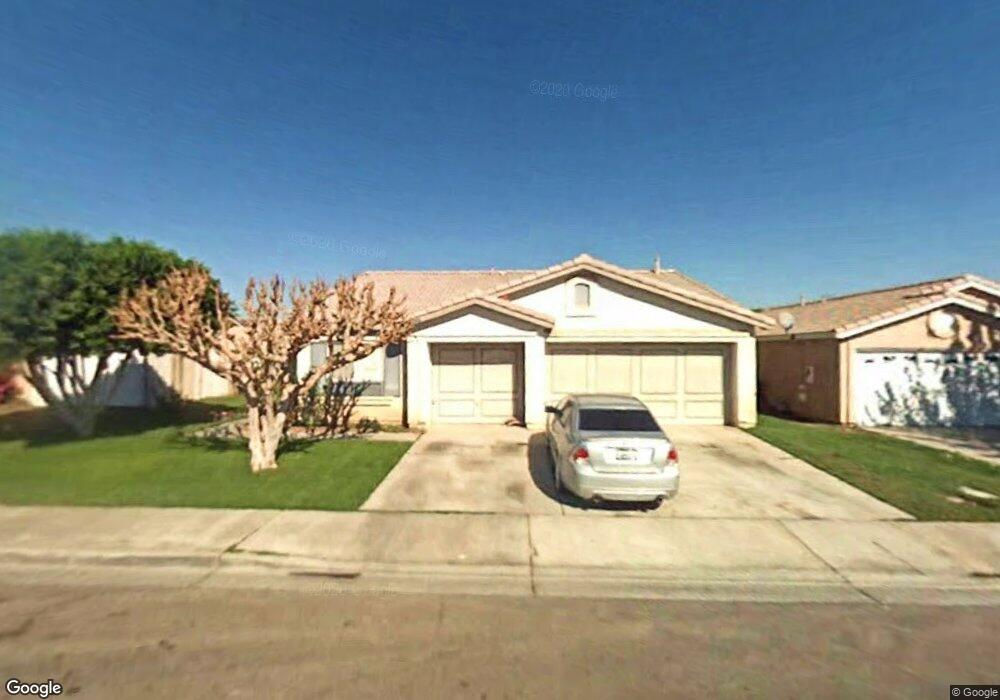
84098 Fiesta Rd Coachella, CA 92236
Estimated Value: $280,000 - $452,000
3
Beds
2
Baths
1,280
Sq Ft
$308/Sq Ft
Est. Value
About This Home
This home is located at 84098 Fiesta Rd, Coachella, CA 92236 and is currently estimated at $394,732, approximately $308 per square foot. 84098 Fiesta Rd is a home located in Riverside County with nearby schools including Cesar Chavez Elementary School, Cahuilla Desert Academy Junior High, and Coachella Valley High School.
Ownership History
Date
Name
Owned For
Owner Type
Purchase Details
Closed on
Oct 23, 2023
Sold by
Vargas Aurora R
Bought by
Aurora R Vargas Revocable Living Trust
Current Estimated Value
Purchase Details
Closed on
Jul 2, 2001
Sold by
Vargas Armando R
Bought by
Vargas Lorenzo E and Vargas Aurora R
Home Financials for this Owner
Home Financials are based on the most recent Mortgage that was taken out on this home.
Original Mortgage
$87,000
Interest Rate
7.21%
Mortgage Type
Purchase Money Mortgage
Purchase Details
Closed on
Jun 13, 1994
Sold by
Coachella Associates
Bought by
Vargas Lorenzo E and Vargas Aurora R
Home Financials for this Owner
Home Financials are based on the most recent Mortgage that was taken out on this home.
Original Mortgage
$85,990
Interest Rate
8.58%
Mortgage Type
Purchase Money Mortgage
Create a Home Valuation Report for This Property
The Home Valuation Report is an in-depth analysis detailing your home's value as well as a comparison with similar homes in the area
Home Values in the Area
Average Home Value in this Area
Purchase History
| Date | Buyer | Sale Price | Title Company |
|---|---|---|---|
| Aurora R Vargas Revocable Living Trust | -- | None Listed On Document | |
| Vargas Lorenzo E | -- | Chicago Title Co | |
| Vargas Lorenzo E | $86,000 | Continental Lawyers Title Co |
Source: Public Records
Mortgage History
| Date | Status | Borrower | Loan Amount |
|---|---|---|---|
| Previous Owner | Vargas Lorenzo E | $87,000 | |
| Previous Owner | Vargas Lorenzo E | $85,990 |
Source: Public Records
Tax History Compared to Growth
Tax History
| Year | Tax Paid | Tax Assessment Tax Assessment Total Assessment is a certain percentage of the fair market value that is determined by local assessors to be the total taxable value of land and additions on the property. | Land | Improvement |
|---|---|---|---|---|
| 2025 | $2,985 | $144,411 | $33,572 | $110,839 |
| 2023 | $2,985 | $138,805 | $32,269 | $106,536 |
| 2022 | $2,870 | $136,085 | $31,637 | $104,448 |
| 2021 | $2,816 | $133,417 | $31,017 | $102,400 |
| 2020 | $2,729 | $132,050 | $30,699 | $101,351 |
| 2019 | $2,658 | $129,462 | $30,098 | $99,364 |
| 2018 | $2,597 | $126,924 | $29,508 | $97,416 |
| 2017 | $2,540 | $124,436 | $28,930 | $95,506 |
| 2016 | $2,451 | $121,997 | $28,363 | $93,634 |
| 2015 | $2,380 | $120,167 | $27,938 | $92,229 |
| 2014 | $1,869 | $117,815 | $27,392 | $90,423 |
Source: Public Records
Map
Nearby Homes
- 83820 Avenida la Luna
- 83805 Avenida la Luna
- 83777 Corte Estivo
- 49511 Cinnabar Ln
- Residence 2 Plan at Rancho Mariposa
- Residence 1 Plan at Rancho Mariposa
- 49634 Redondo Este
- 83697 Shadowrock Dr
- 83680 Jaderock Rd
- 84470 Goya Dr
- 48267 Van Buren St
- 49840 Avenida Cortez
- 84590 Vera Cruz
- 84457 Raphael Way
- 50252 Paseo Barcelona
- 50187 Camino Rosario
- 84448 Calle Rodriguez
- 48596 Charlton Peak St
- Gateway Plan at Pyramid Ranch
- Visionary Plan at Pyramid Ranch
- 84112 Fiesta Rd
- 84086 Fiesta Rd
- 84095 Tera Vista
- 84107 Tera Vista
- 84083 Tera Vista
- 84124 Fiesta Rd
- 84074 Fiesta Rd
- 84099 Fiesta Rd
- 84095 Fiesta Rd
- 84119 Tera Vista
- 84071 Tera Vista
- 84071 Tera Vista
- 84119 Fiesta Rd
- 84136 Fiesta Rd
- 84083 Fiesta Rd
- 84131 Fiesta Rd
- 84131 Tera Vista
- 84071 Fiesta Rd
- 84143 Fiesta Rd
- 84148 Fiesta Rd