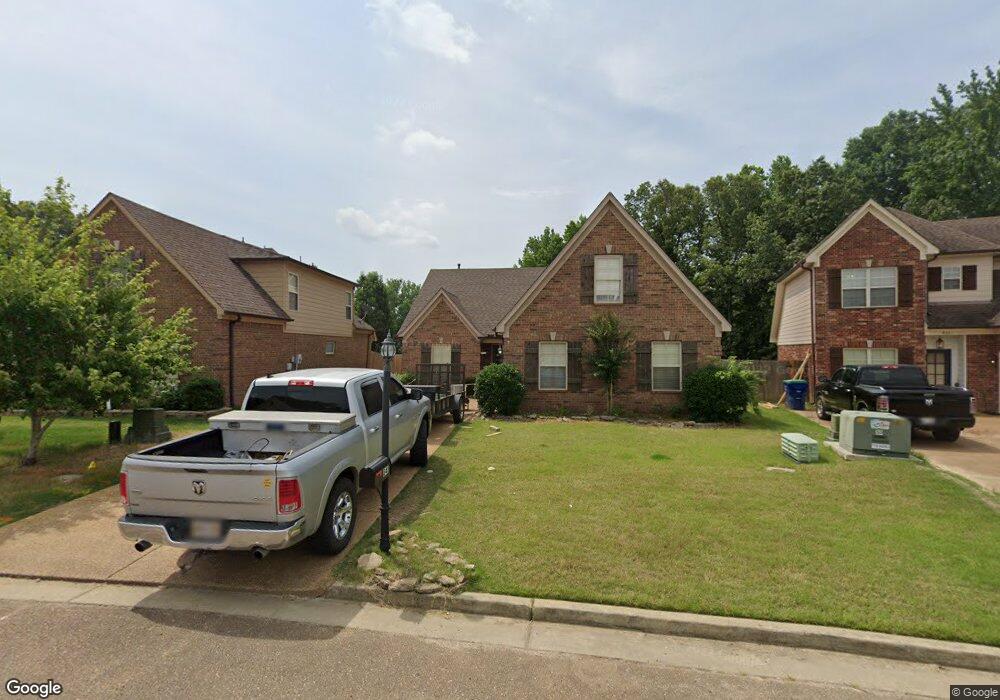
841 Fairway Pointe Cove W Hernando, MS 38632
Estimated Value: $296,000 - $311,000
3
Beds
2
Baths
1,631
Sq Ft
$186/Sq Ft
Est. Value
About This Home
This home is located at 841 Fairway Pointe Cove W, Hernando, MS 38632 and is currently estimated at $303,401, approximately $186 per square foot. 841 Fairway Pointe Cove W is a home located in DeSoto County with nearby schools including Oak Grove Central Elementary School, Hernando Hills Elementary, and Hernando Elementary School.
Ownership History
Date
Name
Owned For
Owner Type
Purchase Details
Closed on
Nov 24, 2020
Sold by
Hill Ryan D and Hill Nancy E
Bought by
Sanseverino Zoie
Current Estimated Value
Home Financials for this Owner
Home Financials are based on the most recent Mortgage that was taken out on this home.
Original Mortgage
$211,111
Outstanding Balance
$188,287
Interest Rate
2.8%
Mortgage Type
New Conventional
Estimated Equity
$115,114
Purchase Details
Closed on
Jan 5, 2016
Sold by
Wilkey Danny and Wilkey Lauren
Bought by
Hill Ryan D and Hill Nancy E
Purchase Details
Closed on
Sep 17, 2009
Sold by
Wheeler Homes Llc
Bought by
Wilkey Danny
Home Financials for this Owner
Home Financials are based on the most recent Mortgage that was taken out on this home.
Original Mortgage
$162,418
Interest Rate
5.11%
Mortgage Type
VA
Create a Home Valuation Report for This Property
The Home Valuation Report is an in-depth analysis detailing your home's value as well as a comparison with similar homes in the area
Home Values in the Area
Average Home Value in this Area
Purchase History
| Date | Buyer | Sale Price | Title Company |
|---|---|---|---|
| Sanseverino Zoie | -- | None Available | |
| Hill Ryan D | -- | None Available | |
| Wilkey Danny | -- | None Available |
Source: Public Records
Mortgage History
| Date | Status | Borrower | Loan Amount |
|---|---|---|---|
| Open | Sanseverino Zoie | $211,111 | |
| Previous Owner | Wilkey Danny | $162,418 |
Source: Public Records
Tax History Compared to Growth
Tax History
| Year | Tax Paid | Tax Assessment Tax Assessment Total Assessment is a certain percentage of the fair market value that is determined by local assessors to be the total taxable value of land and additions on the property. | Land | Improvement |
|---|---|---|---|---|
| 2024 | $1,559 | $13,397 | $2,500 | $10,897 |
| 2023 | $1,559 | $13,397 | $0 | $0 |
| 2022 | $1,559 | $13,397 | $2,500 | $10,897 |
| 2021 | $1,859 | $13,397 | $2,500 | $10,897 |
| 2020 | $1,437 | $12,519 | $2,500 | $10,019 |
| 2019 | $1,437 | $12,519 | $2,500 | $10,019 |
| 2017 | $1,441 | $22,466 | $12,483 | $9,983 |
| 2016 | $1,368 | $12,483 | $2,500 | $9,983 |
| 2015 | $1,668 | $22,466 | $12,483 | $9,983 |
| 2014 | $1,328 | $12,483 | $0 | $0 |
| 2013 | $1,328 | $12,483 | $0 | $0 |
Source: Public Records
Map
Nearby Homes
- 163 Fairway Trace Dr
- 435 Fairway Oaks Dr
- 457 Fairway Oaks Dr
- 723 Fairway Trail
- 817 Fairway Trail
- 727 Bolivar Dr
- 682 Bolivar Dr
- 731 Bolivar Dr
- 582 Bolivar Dr
- 622 Bolivar Dr
- 660 Bolivar Dr
- 726 Coahoma Ct
- 738 Coahoma Ct
- 607 Sunflower St
- 597 Sunflower St
- 617 Sunflower St
- 779 Quitman Ct W
- 767 Coahoma Ct
- 789 Quitman Ct W
- 768 Coahoma Ct
- 849 Fairway Pointe Cove W
- 833 Fairway Pointe Cove W
- 859 Fairway Pointe Cove W
- 823 Fairway Pointe Cove W
- 818 Fairway Pointe Cove W
- 869 Fairway Pointe Cove W
- 850 Fairway Pointe Cove W
- 877 Fairway Pointe Cove W
- 809 Fairway Pointe Cove W
- 887 Fairway Pointe Cove E
- 797 Fairway Pointe Cove W
- 895 Fairway Pointe Cove E
- 791 Fairway Pointe Cove W
- 905 Fairway Pointe Cove E
- 913 Fairway Pointe Cove E
- 777 Fairway Pointe Cove W
- 921 Fairway Pointe Cove E
- 773 Fairway Pointe Cove W
- 933 Fairway Pointe Cove E
- 763 Fairway Pointe Cove W