841 Manning Villas Ct SW Marietta, GA 30064
Southwestern Marietta NeighborhoodEstimated Value: $289,011 - $302,000
2
Beds
2
Baths
1,475
Sq Ft
$201/Sq Ft
Est. Value
About This Home
This home is located at 841 Manning Villas Ct SW, Marietta, GA 30064 and is currently estimated at $296,253, approximately $200 per square foot. 841 Manning Villas Ct SW is a home located in Cobb County with nearby schools including A.L. Burruss Elementary School, Marietta Sixth Grade Academy, and Marietta Middle School.
Ownership History
Date
Name
Owned For
Owner Type
Purchase Details
Closed on
May 2, 2025
Sold by
Walls Wanda A
Bought by
Naing Ei Ei Thein and Moor Sinclair Samuel
Current Estimated Value
Home Financials for this Owner
Home Financials are based on the most recent Mortgage that was taken out on this home.
Original Mortgage
$240,000
Outstanding Balance
$238,939
Interest Rate
6.67%
Mortgage Type
New Conventional
Estimated Equity
$57,314
Purchase Details
Closed on
Dec 1, 2017
Sold by
Washburn Geraldine F
Bought by
Walls Wanda A
Purchase Details
Closed on
Oct 1, 2010
Sold by
Washburn Geraldine F
Bought by
Washburn Geraldine F and Washburn Connie
Purchase Details
Closed on
Feb 16, 1999
Sold by
Brown Margaret L
Bought by
Bauer David W and Bauer Laura A
Home Financials for this Owner
Home Financials are based on the most recent Mortgage that was taken out on this home.
Original Mortgage
$50,100
Interest Rate
6.74%
Mortgage Type
New Conventional
Create a Home Valuation Report for This Property
The Home Valuation Report is an in-depth analysis detailing your home's value as well as a comparison with similar homes in the area
Home Values in the Area
Average Home Value in this Area
Purchase History
| Date | Buyer | Sale Price | Title Company |
|---|---|---|---|
| Naing Ei Ei Thein | $300,000 | None Listed On Document | |
| Naing Ei Ei Thein | $300,000 | None Listed On Document | |
| Walls Wanda A | $160,000 | -- | |
| Washburn Geraldine F | -- | -- | |
| Bauer David W | $89,000 | -- |
Source: Public Records
Mortgage History
| Date | Status | Borrower | Loan Amount |
|---|---|---|---|
| Open | Naing Ei Ei Thein | $240,000 | |
| Closed | Naing Ei Ei Thein | $240,000 | |
| Previous Owner | Bauer David W | $50,100 |
Source: Public Records
Tax History Compared to Growth
Tax History
| Year | Tax Paid | Tax Assessment Tax Assessment Total Assessment is a certain percentage of the fair market value that is determined by local assessors to be the total taxable value of land and additions on the property. | Land | Improvement |
|---|---|---|---|---|
| 2025 | $274 | $110,608 | $34,000 | $76,608 |
| 2024 | $274 | $110,608 | $34,000 | $76,608 |
| 2023 | $122 | $101,604 | $23,200 | $78,404 |
| 2022 | $274 | $86,336 | $23,200 | $63,136 |
| 2021 | $283 | $69,040 | $23,200 | $45,840 |
| 2020 | $283 | $67,208 | $19,200 | $48,008 |
| 2019 | $283 | $64,808 | $16,800 | $48,008 |
| 2018 | $538 | $62,620 | $14,000 | $48,620 |
| 2017 | $215 | $42,440 | $8,800 | $33,640 |
| 2016 | $216 | $42,440 | $8,800 | $33,640 |
| 2015 | $174 | $33,036 | $6,000 | $27,036 |
| 2014 | $178 | $33,036 | $0 | $0 |
Source: Public Records
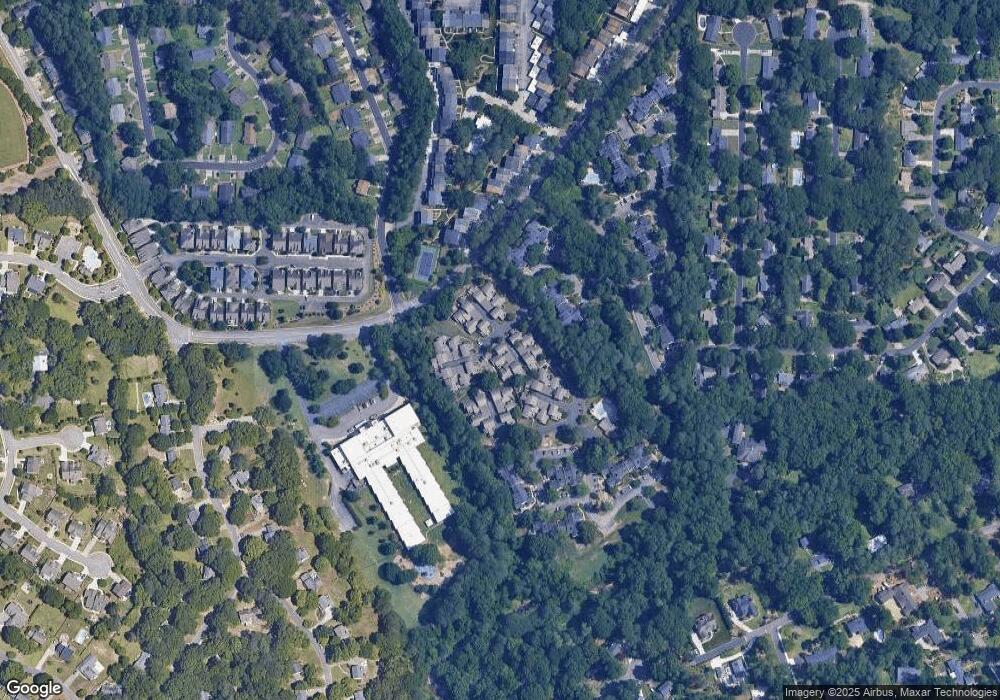
Map
Nearby Homes
- 386 Manning Villas Dr SW Unit 386
- 839 Manning Villas Ct SW
- 834 Cannon Run SW
- 1017 Cannongate Crossing SW
- 916 Cannon Gate Crossing
- 916 Cannongate Crossing SW Unit 916
- 838 Cannon Run SW
- 798 Sentinel Ridge SW
- 1161 Rockmann Terrace SW
- 260 Manning Rd SW Unit 19
- 560 Manning Rd SW
- 106 Westland Ct SW
- 207 Westland Cir SW
- 332 Rockmann Ln SW
- 920 Westland Dr SW
- 594 Manning Rd SW
- 1047 Chestnut Hill Cir SW
- 563 Hillandale Cir SW
- 831 Manning Villas Ct SW Unit 831
- 833 Manning Villas Ct SW Unit 633
- 835 Manning Villas Ct SW
- 837 Manning Villas Ct SW Unit 837
- 843 Manning Villas Ct SW
- 0 Manning Villas Ct
- 420 Manning Villas Ln SW
- 434 Manning Villas Ln SW
- 432 Manning Villas Ln SW
- 430 Manning Villas Ln SW
- 428 Manning Villas Ln SW
- 424 Manning Villas Ln SW
- 434 Manning Villas Ln SW Unit 4
- 424 Manning Villas Ln SW Unit 424
- 380 Manning Villas Dr SW
- 378 Manning Villas Dr SW
- 376 Manning Villas Dr SW
- 374 Manning Villas Dr SW
- 388 Manning Villas Dr SW
- 384 Manning Villas Dr SW