
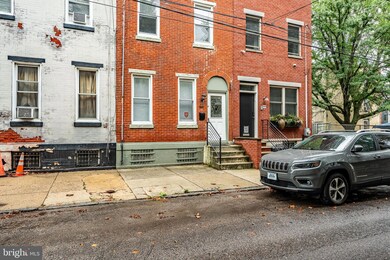
841 Perkiomen St Philadelphia, PA 19130
Fairmount NeighborhoodEstimated payment $3,031/month
Highlights
- Traditional Architecture
- Forced Air Heating and Cooling System
- 3-minute walk to Francisville Recreation Center
- No HOA
About This Home
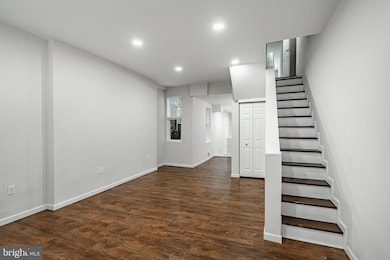
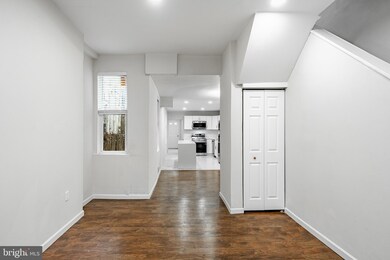
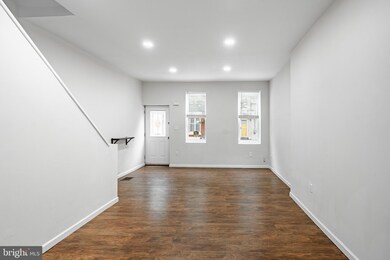
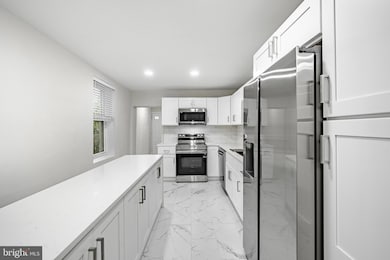
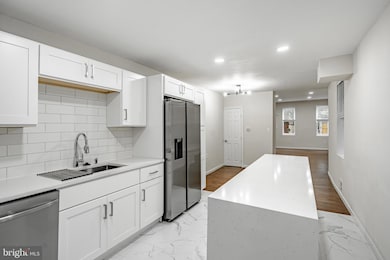
Welcome to your new home in the heart of Fairmount! This stunning 3-bedroom, 3.5-bath residence combines timeless Philadelphia charm with modern updates, offering a perfect blend of style, comfort, and convenience. Step inside to discover a recently updated kitchen, featuring sleek cabinetry, stainless steel appliances designed for both everyday living and entertaining. The bathrooms have also been thoughtfully renovated with contemporary finishes, providing a spa-like retreat in every space. With three spacious bedrooms each with their own ensuite bathrooms, this home offers both privacy and functionality for today’s lifestyle. Move-in ready, it’s an ideal opportunity for anyone seeking a seamless transition into one of Philadelphia’s most desirable neighborhoods. Located in the sought-after Fairmount section, you’ll enjoy easy access to the city’s best amenities—cafés, restaurants, boutiques, parks, and cultural attractions like the Philadelphia Museum of Art and Kelly Drive are just moments away. Don’t miss the chance to make this beautifully updated, centrally located home your own.
Listing Agent
(610) 202-2809 trevor@trevorwilliamsteam.com VRA Realty License #RS316901 Listed on: 09/26/2025
Townhouse Details
Home Type
- Townhome
Est. Annual Taxes
- $6,700
Year Built
- Built in 1920
Lot Details
- 985 Sq Ft Lot
- Lot Dimensions are 15.00 x 65.00
Parking
- On-Street Parking
Home Design
- Traditional Architecture
- Concrete Perimeter Foundation
- Masonry
Interior Spaces
- 1,815 Sq Ft Home
- Property has 3 Levels
- Unfinished Basement
Bedrooms and Bathrooms
- 3 Main Level Bedrooms
Utilities
- Forced Air Heating and Cooling System
- Natural Gas Water Heater
Community Details
- No Home Owners Association
- Fairmount Subdivision
Listing and Financial Details
- Tax Lot 28
- Assessor Parcel Number 151372700
Map
Home Values in the Area
Average Home Value in this Area
Tax History
| Year | Tax Paid | Tax Assessment Tax Assessment Total Assessment is a certain percentage of the fair market value that is determined by local assessors to be the total taxable value of land and additions on the property. | Land | Improvement |
|---|---|---|---|---|
| 2026 | $5,556 | $478,700 | $95,740 | $382,960 |
| 2025 | $5,556 | $478,700 | $95,740 | $382,960 |
| 2024 | $5,556 | $478,700 | $95,740 | $382,960 |
| 2023 | $5,556 | $396,900 | $79,380 | $317,520 |
| 2022 | $4,162 | $351,900 | $79,380 | $272,520 |
| 2021 | $4,792 | $0 | $0 | $0 |
| 2020 | $4,792 | $0 | $0 | $0 |
| 2019 | $4,638 | $0 | $0 | $0 |
| 2018 | $3,481 | $0 | $0 | $0 |
| 2017 | $3,481 | $0 | $0 | $0 |
| 2016 | $3,061 | $0 | $0 | $0 |
| 2015 | $2,931 | $0 | $0 | $0 |
| 2014 | -- | $248,700 | $39,909 | $208,791 |
| 2012 | -- | $4,928 | $1,474 | $3,454 |
Property History
| Date | Event | Price | List to Sale | Price per Sq Ft |
|---|---|---|---|---|
| 11/12/2025 11/12/25 | Price Changed | $470,000 | -1.1% | $259 / Sq Ft |
| 09/26/2025 09/26/25 | For Sale | $475,000 | -- | $262 / Sq Ft |
Purchase History
| Date | Type | Sale Price | Title Company |
|---|---|---|---|
| Deed | $172,500 | None Available | |
| Deed In Lieu Of Foreclosure | -- | None Available | |
| Deed | $45,000 | -- |
Mortgage History
| Date | Status | Loan Amount | Loan Type |
|---|---|---|---|
| Previous Owner | $138,000 | New Conventional |
Source: Bright MLS
MLS Number: PAPH2541982
APN: 151372700
Disclaimer: Certain information contained herein is derived from information provided by parties other than Homes.com. All information provided is deemed reliable, but is not guaranteed to be accurate and should be independently verified.
![]() The data relating to real estate for sale on this website appears in part through the BRIGHT Internet Data Exchange program, a voluntary cooperative exchange of property listing data between licensed real estate brokerage firms, and is provided by BRIGHT through a licensing agreement.
The data relating to real estate for sale on this website appears in part through the BRIGHT Internet Data Exchange program, a voluntary cooperative exchange of property listing data between licensed real estate brokerage firms, and is provided by BRIGHT through a licensing agreement.
Listing information is from various brokers who participate in the Bright MLS IDX program and not all listings may be visible on the site.
The property information being provided on or through the website is for the personal, non-commercial use of consumers and such information may not be used for any purpose other than to identify prospective properties consumers may be interested in purchasing.
Some properties which appear for sale on the website may no longer be available because they are for instance, under contract, sold or are no longer being offered for sale.
Property information displayed is deemed reliable but is not guaranteed.
Copyright 2025 Bright MLS, Inc.
- 840 Leland St
- 1734 Wylie St Unit B
- 815 Perkiomen St Unit 17
- 815 Perkiomen St Unit 14
- 1642-44 Ridge Ave
- 1639 Francis St
- 1636 Ridge Ave Unit 2
- 1622 24 Ridge Ave
- 1723 Francis St Unit 1B
- 856 Perkiomen St
- 858 Perkiomen St
- 809 Cameron St
- 861 Perkiomen St
- 1729 Francis St
- 830 Cameron St
- 1625 Ogden St Unit B
- 1715 Ridge Ave
- 1608 Ridge Ave Unit 403
- 1608 Ridge Ave Unit 302
- 1605 Ridge Ave
- 819 Cameron St Unit 1
- 840 Leland St
- 873 Perkiomen St
- 828 Leland St
- 1723 Francis St Unit 1B
- 901 Leland St
- 901 Leland St Unit 1B-210
- 901 Leland St Unit 1B-408
- 901 Leland St Unit 1B-303
- 901 Leland St Unit 1B-607
- 901 Leland St Unit 2B-304
- 901 Leland St Unit 1B-507
- 901 Leland St Unit 1B-102
- 1636 Ridge Ave Unit PH
- 1721 Ridge Ave Unit C101
- 1721 Ridge Ave Unit A438
- 1634 Ridge Ave Unit D
- 1716 Cambridge St Unit 2
- 909 N 19th St Unit B
- 814 N Uber St Unit 2
