841 Recluse Rd Recluse, WY 82725
Estimated payment $53,341/month
About This Lot
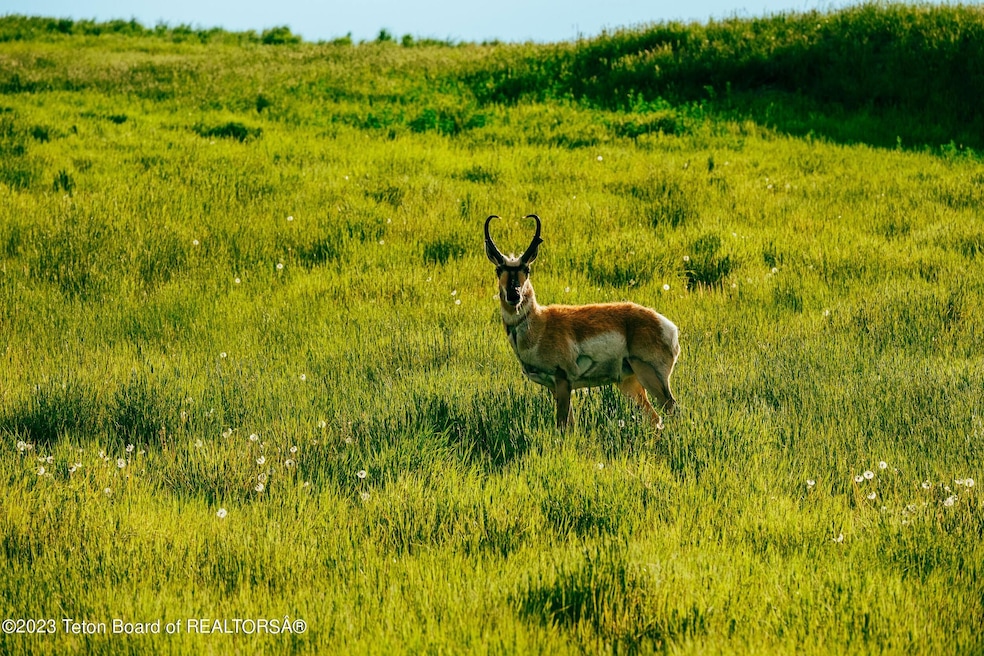
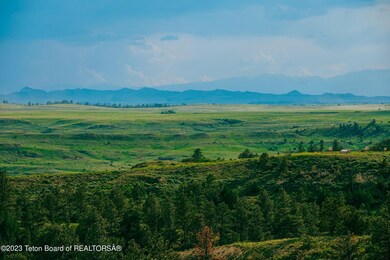
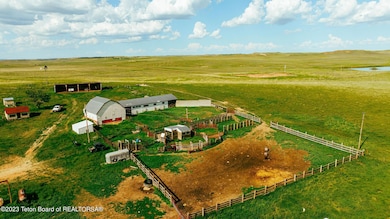
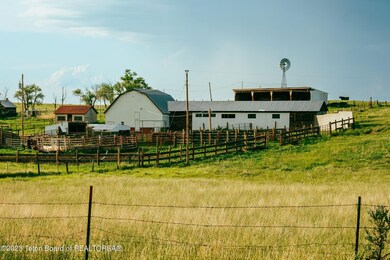
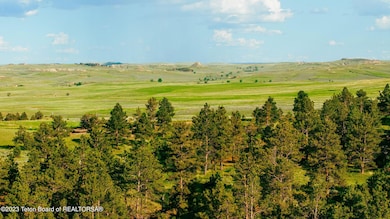
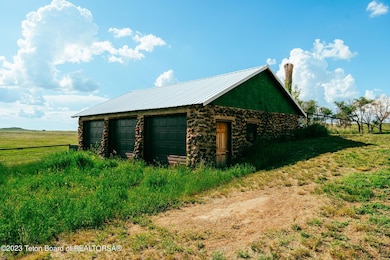
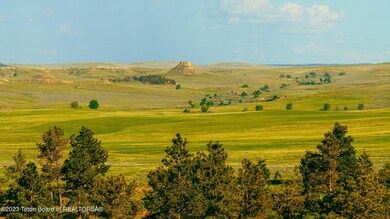
In the same family for over 50 years, Brug Land & Livestock has managed this ranch running 250 pair, consistently year over year, on a property that every year has put up enough dry land hay production to feed all of the livestock during the winter months. Located near Recluse, Wyoming, this large 7,600 acre ranch (6,762 +/- deeded acres) has been well maintained and never overgrazed. This part of Wyoming is known for consistent moisture and excellent grass production. In excellent ''turn-key'' condition, Brug Land & Livestock has received many management and stewardship awards. Located in a very favorable moisture content area of northeast Wyoming, this ranch produces ample hay without irrigation! In the past 50 plus years, the current owners have only purchased hay on three occasions. In addition to being an excellent cattle operation, Brug Land & Livestock has run a consistent Outfitting business for the past 40 plus years. Excellent Mule Deer and Antelope hunting on this very productive grass ranch.
Listing Agent
LiveJacksonHole LiveJacksonHole
Compass Ranch & Land

Property Details
Property Type
- Land
Est. Annual Taxes
- $5,032
Year Built
- 1958
Map
Home Values in the Area
Average Home Value in this Area
Tax History
| Year | Tax Paid | Tax Assessment Tax Assessment Total Assessment is a certain percentage of the fair market value that is determined by local assessors to be the total taxable value of land and additions on the property. | Land | Improvement |
|---|---|---|---|---|
| 2024 | $5,032 | $80,753 | $66,311 | $14,442 |
| 2023 | $4,604 | $73,836 | $59,300 | $14,536 |
| 2022 | $3,880 | $62,031 | $50,027 | $12,004 |
| 2021 | $3,436 | $57,048 | $47,111 | $9,937 |
| 2020 | $3,519 | $58,599 | $48,833 | $9,766 |
| 2019 | $3,492 | $58,289 | $48,278 | $10,011 |
| 2018 | $3,586 | $60,164 | $50,699 | $9,465 |
| 2017 | $3,901 | $65,606 | $56,274 | $9,332 |
| 2016 | $3,840 | $64,485 | $55,390 | $9,095 |
| 2015 | -- | $55,669 | $46,835 | $8,834 |
| 2014 | -- | $50,509 | $43,973 | $6,536 |
Property History
| Date | Event | Price | Change | Sq Ft Price |
|---|---|---|---|---|
| 07/19/2024 07/19/24 | For Sale | $9,500,000 | 0.0% | -- |
| 06/20/2023 06/20/23 | For Sale | $9,500,000 | -- | -- |