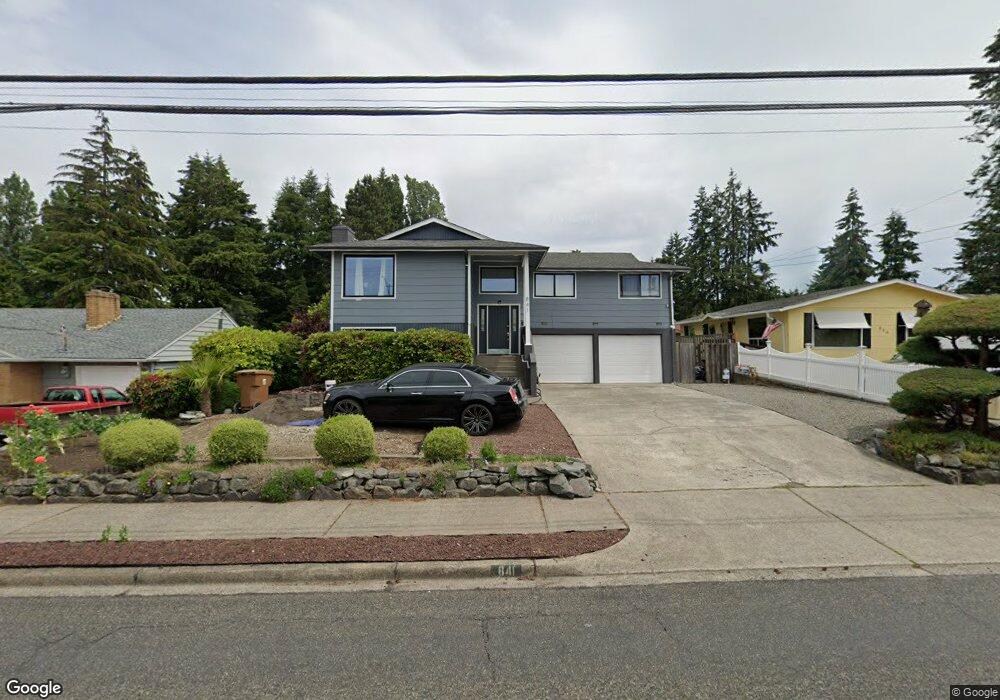
841 S Jackson Ave Tacoma, WA 98465
West End NeighborhoodEstimated Value: $570,000 - $671,000
3
Beds
3
Baths
2,164
Sq Ft
$284/Sq Ft
Est. Value
About This Home
This home is located at 841 S Jackson Ave, Tacoma, WA 98465 and is currently estimated at $614,444, approximately $283 per square foot. 841 S Jackson Ave is a home located in Pierce County with nearby schools including Geiger Montessori School, Truman Middle School, and Foss High School.
Ownership History
Date
Name
Owned For
Owner Type
Purchase Details
Closed on
May 25, 2022
Sold by
Long Vantran
Bought by
Vantran Long and Huynh Ngocdiem
Current Estimated Value
Home Financials for this Owner
Home Financials are based on the most recent Mortgage that was taken out on this home.
Original Mortgage
$397,500
Outstanding Balance
$376,758
Interest Rate
5%
Mortgage Type
New Conventional
Estimated Equity
$237,686
Purchase Details
Closed on
Jun 20, 2018
Sold by
Lindsey Stanis Sauro and Lindsey Stanis Sauro
Bought by
Vantran Long and Huynh Ngocdiem
Home Financials for this Owner
Home Financials are based on the most recent Mortgage that was taken out on this home.
Original Mortgage
$334,757
Interest Rate
5.12%
Mortgage Type
FHA
Purchase Details
Closed on
Feb 21, 2007
Sold by
James & Stanis Lindsey Living Trust
Bought by
Lindsey Stanis Sauro
Purchase Details
Closed on
Oct 28, 2002
Sold by
Lindsey Stanis and Sauro Stanis
Bought by
Lindsey James A and Lindsey Stanis
Create a Home Valuation Report for This Property
The Home Valuation Report is an in-depth analysis detailing your home's value as well as a comparison with similar homes in the area
Home Values in the Area
Average Home Value in this Area
Purchase History
| Date | Buyer | Sale Price | Title Company |
|---|---|---|---|
| Vantran Long | -- | Wfg National Title Company Of | |
| Vantran Long | $349,719 | Chicago Title | |
| Lindsey Stanis Sauro | -- | None Available | |
| Lindsey James A | -- | -- |
Source: Public Records
Mortgage History
| Date | Status | Borrower | Loan Amount |
|---|---|---|---|
| Open | Vantran Long | $397,500 | |
| Previous Owner | Vantran Long | $334,757 |
Source: Public Records
Tax History Compared to Growth
Tax History
| Year | Tax Paid | Tax Assessment Tax Assessment Total Assessment is a certain percentage of the fair market value that is determined by local assessors to be the total taxable value of land and additions on the property. | Land | Improvement |
|---|---|---|---|---|
| 2025 | $5,335 | $566,000 | $257,500 | $308,500 |
| 2024 | $5,335 | $538,100 | $249,700 | $288,400 |
| 2023 | $5,335 | $479,300 | $230,500 | $248,800 |
| 2022 | $4,877 | $515,800 | $238,800 | $277,000 |
| 2021 | $4,620 | $367,600 | $155,200 | $212,400 |
| 2019 | $3,983 | $340,200 | $138,500 | $201,700 |
| 2018 | $4,525 | $306,500 | $112,900 | $193,600 |
| 2017 | $4,077 | $286,500 | $103,600 | $182,900 |
| 2016 | $3,697 | $237,500 | $78,200 | $159,300 |
| 2014 | $1,684 | $212,700 | $72,600 | $140,100 |
| 2013 | $1,684 | $196,900 | $65,200 | $131,700 |
Source: Public Records
Map
Nearby Homes
- 805 S Geiger St
- 625 N Jackson Ave Unit A15
- 625 N Jackson Ave Unit C24
- 7324 N Skyview Ln Unit N202
- 7322 N Skyview Ln Unit N103
- 7310 N Skyview Ln Unit 301
- 638 N Skyline Dr
- 1027 S Rochester St
- 1224 S Sunset Dr
- 7517 N 10th St
- 1116 N Jackson Ave
- 7613 N 10th St
- 1311 N Jackson Ave
- 1902 Bridgeport Way W Unit 106
- 7654 19th St W Unit 7654
- 1142 N Skyline Dr
- 1128 Lenore Dr
- 7848 N Woodworth Ave
- 2120 Seaview St W
- 1342 N Lenore Dr
- 835 S Jackson Ave
- 7415 S 10th St
- 851 S Jackson Ave
- 831 S Jackson Ave
- 7409 S 10th St
- 855 S Jackson Ave
- 829 S Jackson Ave
- 916 S Jackson Ave
- 908 S Jackson Ave
- 7422 S 10th St
- 823 S Jackson Ave
- 924 S Jackson Ave
- 1011 S Jackson Ave
- 821 S Jackson Ave
- 840 S Geiger St
- 825 S Jackson Ave
- 836 S Geiger St
- 902 S Jackson Ave
- 832 S Geiger St