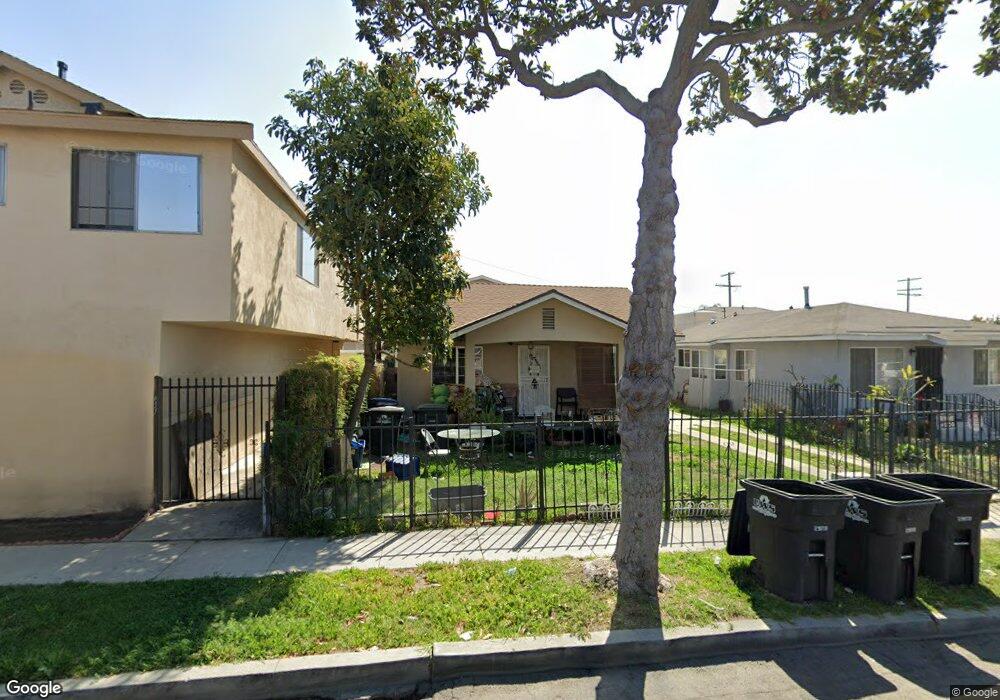
8412 Cypress Ave South Gate, CA 90280
Estimated Value: $783,000 - $933,386
6
Beds
3
Baths
2,632
Sq Ft
$326/Sq Ft
Est. Value
About This Home
This home is located at 8412 Cypress Ave, South Gate, CA 90280 and is currently estimated at $859,097, approximately $326 per square foot. 8412 Cypress Ave is a home located in Los Angeles County with nearby schools including Independence Elementary School, Walnut Park Middle School, and South Gate High School.
Ownership History
Date
Name
Owned For
Owner Type
Purchase Details
Closed on
Jun 29, 2006
Sold by
Arellanes Jesus Javier and Urbina Joel
Bought by
Urbina Veronica and Martinez Javier Arellanes
Current Estimated Value
Purchase Details
Closed on
Jan 16, 1996
Sold by
Palacios Rachel
Bought by
Urbina Joel
Home Financials for this Owner
Home Financials are based on the most recent Mortgage that was taken out on this home.
Original Mortgage
$185,580
Interest Rate
7.18%
Purchase Details
Closed on
Dec 20, 1995
Sold by
Federal Home Loan Mortgage Corporation
Bought by
Arellanes Jesus Javier and Urbina Joel
Home Financials for this Owner
Home Financials are based on the most recent Mortgage that was taken out on this home.
Original Mortgage
$185,580
Interest Rate
7.18%
Purchase Details
Closed on
Jun 7, 1995
Sold by
Prouty Howard and Prouty Yvette
Bought by
Sun West Mtg Company Inc
Purchase Details
Closed on
May 31, 1994
Sold by
Prouty Howard
Bought by
Prouty Yvette
Create a Home Valuation Report for This Property
The Home Valuation Report is an in-depth analysis detailing your home's value as well as a comparison with similar homes in the area
Home Values in the Area
Average Home Value in this Area
Purchase History
| Date | Buyer | Sale Price | Title Company |
|---|---|---|---|
| Urbina Veronica | -- | None Available | |
| Urbina Joel | -- | -- | |
| Arellanes Jesus Javier | $195,500 | First American Title Co | |
| Sun West Mtg Company Inc | $195,000 | North American Title Co | |
| Prouty Yvette | -- | -- |
Source: Public Records
Mortgage History
| Date | Status | Borrower | Loan Amount |
|---|---|---|---|
| Previous Owner | Arellanes Jesus Javier | $185,580 |
Source: Public Records
Tax History
| Year | Tax Paid | Tax Assessment Tax Assessment Total Assessment is a certain percentage of the fair market value that is determined by local assessors to be the total taxable value of land and additions on the property. | Land | Improvement |
|---|---|---|---|---|
| 2025 | $7,596 | $582,265 | $379,498 | $202,767 |
| 2024 | $7,596 | $570,849 | $372,057 | $198,792 |
| 2023 | $7,466 | $559,657 | $364,762 | $194,895 |
| 2022 | $7,112 | $548,684 | $357,610 | $191,074 |
| 2021 | $7,022 | $537,927 | $350,599 | $187,328 |
| 2020 | $7,075 | $532,413 | $347,005 | $185,408 |
| 2019 | $6,801 | $521,974 | $340,201 | $181,773 |
| 2018 | $6,633 | $511,740 | $333,531 | $178,209 |
| 2016 | $6,328 | $491,871 | $320,581 | $171,290 |
| 2015 | $6,227 | $484,484 | $315,766 | $168,718 |
| 2014 | $6,229 | $474,995 | $309,581 | $165,414 |
Source: Public Records
Map
Nearby Homes
- 8461 Garden View Ave
- 8469 Cypress Ave
- 3062 Ardmore Ave
- 8600 S Gate Ave
- 3112 Cudahy St
- 3146 Cudahy St
- 2844 Ardmore Ave
- 8137 Beechwood Ave
- 3241 Santa Ana St
- 3036 Hill St
- 3107 Hill St
- 2912 Hill St
- 3213 Hill St
- 3353 Cudahy St
- 8954 S Gate Ave
- 8468 Virginia Ave
- 3420 Cudahy St
- 2565 Sale Place
- 8995 Victoria Ave
- 8455 Santa fe Ave
- 8416 Cypress Ave
- 8420 Cypress Ave
- 3054 Liberty Blvd
- 3060 Liberty Blvd
- 8424 Cypress Ave
- 3066 Liberty Blvd
- 8413 Garden View Ave
- 8428 Cypress Ave
- 3070 Liberty Blvd
- 8421 Garden View Ave
- 8425 Garden View Ave
- 8413 Cypress Ave
- 8432 Cypress Ave
- 8417 Cypress Ave
- 8421 Cypress Ave
- 8429 Garden View Ave
- 3020 Liberty Blvd
- 8425 Cypress Ave
- 8436 Cypress Ave
- 3067 Liberty Blvd
Your Personal Tour Guide
Ask me questions while you tour the home.