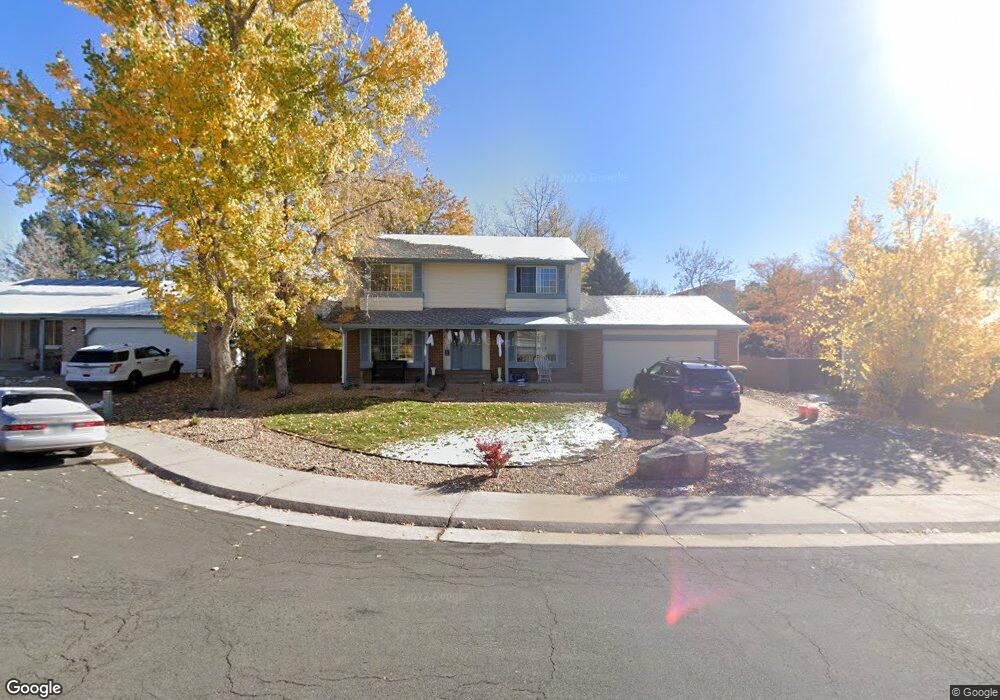
8412 S Sunflower St Highlands Ranch, CO 80126
Northridge NeighborhoodEstimated Value: $596,000 - $645,000
3
Beds
3
Baths
1,768
Sq Ft
$351/Sq Ft
Est. Value
About This Home
This home is located at 8412 S Sunflower St, Highlands Ranch, CO 80126 and is currently estimated at $621,076, approximately $351 per square foot. 8412 S Sunflower St is a home located in Douglas County with nearby schools including Northridge Elementary School, Mountain Ridge Middle School, and Mountain Vista High School.
Ownership History
Date
Name
Owned For
Owner Type
Purchase Details
Closed on
Nov 15, 2006
Sold by
Hriso Gregory J and Hriso Ann N
Bought by
Rodger Jonathan M and Rodger Annette M
Current Estimated Value
Purchase Details
Closed on
Feb 21, 2006
Sold by
Leung Michael Sai Wing and Leung Mary
Bought by
Hriso Gregory J and Hriso Ann N
Home Financials for this Owner
Home Financials are based on the most recent Mortgage that was taken out on this home.
Original Mortgage
$162,000
Interest Rate
6.05%
Mortgage Type
Fannie Mae Freddie Mac
Purchase Details
Closed on
Apr 26, 1990
Sold by
Mission Viejo Co
Bought by
Leung Michael Sai Wing and Leung Mary
Purchase Details
Closed on
Jan 20, 1988
Sold by
Winery Raymond H and Winery Denise S
Bought by
Enyart Ewing E and Enyart Jean M
Purchase Details
Closed on
Mar 12, 1984
Sold by
Mission Veijo Co
Bought by
Whinery Raymond H and Whinery Denise S
Create a Home Valuation Report for This Property
The Home Valuation Report is an in-depth analysis detailing your home's value as well as a comparison with similar homes in the area
Home Values in the Area
Average Home Value in this Area
Purchase History
| Date | Buyer | Sale Price | Title Company |
|---|---|---|---|
| Rodger Jonathan M | $249,500 | -- | |
| Hriso Gregory J | $202,500 | Utc | |
| Leung Michael Sai Wing | $107,500 | -- | |
| Enyart Ewing E | $110,500 | -- | |
| Whinery Raymond H | $122,700 | -- |
Source: Public Records
Mortgage History
| Date | Status | Borrower | Loan Amount |
|---|---|---|---|
| Previous Owner | Hriso Gregory J | $162,000 |
Source: Public Records
Tax History Compared to Growth
Tax History
| Year | Tax Paid | Tax Assessment Tax Assessment Total Assessment is a certain percentage of the fair market value that is determined by local assessors to be the total taxable value of land and additions on the property. | Land | Improvement |
|---|---|---|---|---|
| 2024 | $3,851 | $44,550 | $12,100 | $32,450 |
| 2023 | $3,844 | $44,550 | $12,100 | $32,450 |
| 2022 | $2,858 | $31,280 | $8,150 | $23,130 |
| 2021 | $2,973 | $31,280 | $8,150 | $23,130 |
| 2020 | $2,770 | $29,870 | $7,870 | $22,000 |
| 2019 | $2,781 | $29,870 | $7,870 | $22,000 |
| 2018 | $2,503 | $26,480 | $6,800 | $19,680 |
| 2017 | $2,279 | $26,480 | $6,800 | $19,680 |
| 2016 | $2,014 | $22,970 | $7,420 | $15,550 |
| 2015 | $1,029 | $22,970 | $7,420 | $15,550 |
| 2014 | $922 | $19,010 | $4,940 | $14,070 |
Source: Public Records
Map
Nearby Homes
- 804 Homestead Dr
- 8473 Tanglewood St
- 843 Homestead Dr
- 8441 Timberwood St
- 8376 Cobblestone St
- 8397 Cobblestone Ct
- 904 Fieldstone Place
- 1241 Northcrest Dr
- 1186 Cobblestone Dr
- 8196 S Logan Ct
- 507 Fox Hunt Cir
- 1384 Briar Cir
- 1431 Northcrest Dr
- 8725 Meadowlark Cir
- 8745 Meadowlark Cir
- 714 Old Stone Dr
- 995 E Otero Ave
- 8822 Eagles Nest Ln
- 1551 Northridge Dr
- 7932 S Corona Ct
- 8422 S Sunflower St
- 8402 S Sunflower St
- 8413 Tanglewood St
- 8403 Tanglewood St
- 8423 Tanglewood St
- 8432 S Sunflower St
- 8411 S Sunflower St
- 8421 S Sunflower St
- 8433 Tanglewood St
- 8401 S Sunflower St
- 8442 S Sunflower St
- 8431 S Sunflower St
- 8443 Tanglewood St
- 8441 S Sunflower St
- 8381 White Cloud St
- 8452 S Sunflower St
- 8416 S Wildcat St
- 8414 Tanglewood St
- 512 White Cloud Dr
- 8382 White Cloud St