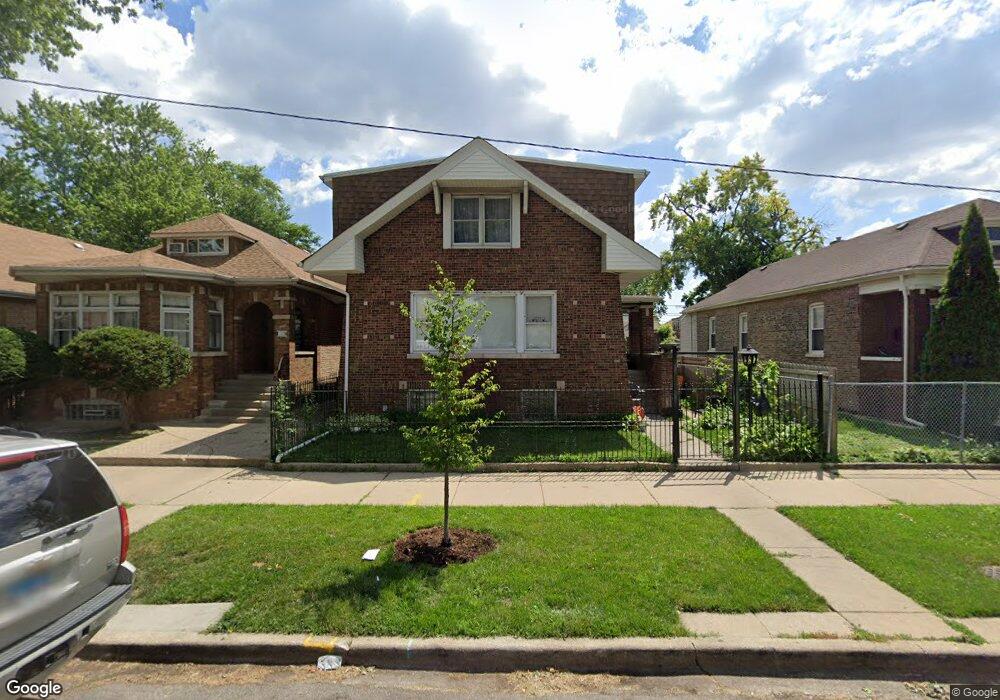
8417 S Aberdeen St Chicago, IL 60620
Auburn Gresham NeighborhoodEstimated Value: $181,000 - $265,000
--
Bed
2
Baths
1,697
Sq Ft
$128/Sq Ft
Est. Value
About This Home
This home is located at 8417 S Aberdeen St, Chicago, IL 60620 and is currently estimated at $217,798, approximately $128 per square foot. 8417 S Aberdeen St is a home located in Cook County with nearby schools including Gresham School of Excellence, Emil G. Hirsch Metropolitan High School, and Hansberry College Prep.
Ownership History
Date
Name
Owned For
Owner Type
Purchase Details
Closed on
Oct 20, 2004
Sold by
Allen James
Bought by
Allen James and Allen Rose M
Current Estimated Value
Home Financials for this Owner
Home Financials are based on the most recent Mortgage that was taken out on this home.
Original Mortgage
$148,750
Outstanding Balance
$82,075
Interest Rate
7.85%
Mortgage Type
New Conventional
Estimated Equity
$135,723
Purchase Details
Closed on
Aug 1, 1997
Sold by
Elite Neighborhood Homes & Associates
Bought by
Allen James
Home Financials for this Owner
Home Financials are based on the most recent Mortgage that was taken out on this home.
Original Mortgage
$114,929
Interest Rate
7.57%
Mortgage Type
FHA
Purchase Details
Closed on
Dec 12, 1996
Sold by
Cook County Development Corp
Bought by
Elite Neighborhood Homes & Associates
Purchase Details
Closed on
Nov 13, 1996
Sold by
Griffin James
Bought by
Cook County Development Corp
Create a Home Valuation Report for This Property
The Home Valuation Report is an in-depth analysis detailing your home's value as well as a comparison with similar homes in the area
Home Values in the Area
Average Home Value in this Area
Purchase History
| Date | Buyer | Sale Price | Title Company |
|---|---|---|---|
| Allen James | -- | -- | |
| Allen James | $76,666 | -- | |
| Elite Neighborhood Homes & Associates | $34,000 | -- | |
| Cook County Development Corp | -- | -- | |
| Cook County Development Corp | $16,000 | -- |
Source: Public Records
Mortgage History
| Date | Status | Borrower | Loan Amount |
|---|---|---|---|
| Open | Allen James | $148,750 | |
| Closed | Allen James | $114,929 |
Source: Public Records
Tax History
| Year | Tax Paid | Tax Assessment Tax Assessment Total Assessment is a certain percentage of the fair market value that is determined by local assessors to be the total taxable value of land and additions on the property. | Land | Improvement |
|---|---|---|---|---|
| 2025 | $1,484 | $14,001 | $2,438 | $11,563 |
| 2024 | $1,484 | $14,001 | $2,438 | $11,563 |
| 2023 | $1,407 | $13,000 | $3,656 | $9,344 |
| 2022 | $1,407 | $13,000 | $3,656 | $9,344 |
| 2021 | $1,409 | $12,999 | $3,656 | $9,343 |
| 2020 | $2,411 | $16,406 | $3,656 | $12,750 |
| 2019 | $2,382 | $18,029 | $3,656 | $14,373 |
| 2018 | $2,340 | $18,029 | $3,656 | $14,373 |
| 2017 | $3,601 | $16,728 | $3,168 | $13,560 |
| 2016 | $2,493 | $16,728 | $3,168 | $13,560 |
| 2015 | $3,065 | $16,728 | $3,168 | $13,560 |
| 2014 | $2,616 | $14,102 | $2,925 | $11,177 |
| 2013 | $1,745 | $14,102 | $2,925 | $11,177 |
Source: Public Records
Map
Nearby Homes
- 8420 S Carpenter St
- 8404 S Carpenter St
- 8423 S Carpenter St
- 8346 S Aberdeen St
- 8438 S Morgan St
- 8419 S Morgan St
- 8317 S Aberdeen St
- 8521 S Carpenter St
- 8414 S Sangamon St
- 8327 S Morgan St
- 8411 S Elizabeth St
- 8429 S Sangamon St
- 8251 S Carpenter St
- 8337 S Sangamon St
- 8513 S Sangamon St
- 8440 S Peoria St
- 8611 S Aberdeen St
- 8318 S Peoria St
- 8607 S Morgan St
- 8618 S Morgan St
- 8421 S Aberdeen St
- 8413 S Aberdeen St
- 8413 S Aberdeen St
- 8425 S Aberdeen St
- 8409 S Aberdeen St
- 8405 S Aberdeen St
- 8414 S Carpenter St
- 8414 S Carpenter St
- 8403 S Aberdeen St
- 8433 S Aberdeen St
- 8422 S Carpenter St
- 8410 S Carpenter St
- 8426 S Carpenter St
- 8401 S Aberdeen St
- 8408 S Carpenter St
- 8428 S Carpenter St
- 8437 S Aberdeen St
- 8416 S Aberdeen St
- 8420 S Aberdeen St
- 8414 S Aberdeen St
Your Personal Tour Guide
Ask me questions while you tour the home.