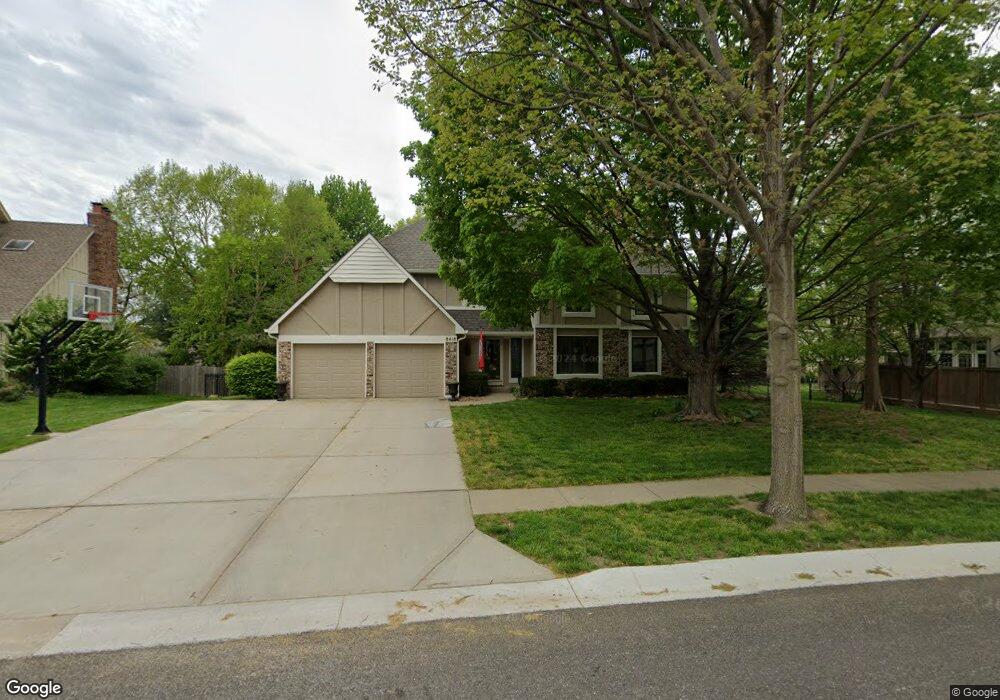
8418 Richards Rd Lenexa, KS 66215
Estimated Value: $522,888 - $581,000
5
Beds
4
Baths
2,839
Sq Ft
$196/Sq Ft
Est. Value
About This Home
This home is located at 8418 Richards Rd, Lenexa, KS 66215 and is currently estimated at $557,222, approximately $196 per square foot. 8418 Richards Rd is a home located in Johnson County with nearby schools including Rising Star Elementary School, Trailridge Middle School, and Shawnee Mission Northwest High School.
Ownership History
Date
Name
Owned For
Owner Type
Purchase Details
Closed on
Sep 26, 2022
Sold by
Walters Mark L and Walters Maria L
Bought by
Walters Living Trust
Current Estimated Value
Purchase Details
Closed on
Jan 27, 2004
Sold by
Prudential Residential Services Lp
Bought by
Walters Mark L and Walters Maria L
Home Financials for this Owner
Home Financials are based on the most recent Mortgage that was taken out on this home.
Original Mortgage
$216,000
Interest Rate
3.75%
Mortgage Type
Purchase Money Mortgage
Purchase Details
Closed on
Dec 13, 2003
Sold by
Hughes Coons Cynthia and Coons Dean
Bought by
Prudential Residential Services Lp and Prudential Homes Corp
Home Financials for this Owner
Home Financials are based on the most recent Mortgage that was taken out on this home.
Original Mortgage
$216,000
Interest Rate
3.75%
Mortgage Type
Purchase Money Mortgage
Create a Home Valuation Report for This Property
The Home Valuation Report is an in-depth analysis detailing your home's value as well as a comparison with similar homes in the area
Home Values in the Area
Average Home Value in this Area
Purchase History
| Date | Buyer | Sale Price | Title Company |
|---|---|---|---|
| Walters Living Trust | -- | -- | |
| Walters Mark L | -- | Chicago Title Insurance Comp | |
| Prudential Residential Services Lp | -- | Chicago Title Insurance Comp |
Source: Public Records
Mortgage History
| Date | Status | Borrower | Loan Amount |
|---|---|---|---|
| Previous Owner | Walters Mark L | $216,000 |
Source: Public Records
Tax History
| Year | Tax Paid | Tax Assessment Tax Assessment Total Assessment is a certain percentage of the fair market value that is determined by local assessors to be the total taxable value of land and additions on the property. | Land | Improvement |
|---|---|---|---|---|
| 2025 | $6,348 | $60,674 | $11,514 | $49,160 |
| 2024 | $6,348 | $57,224 | $10,472 | $46,752 |
| 2023 | $6,515 | $57,914 | $9,979 | $47,935 |
| 2022 | $5,946 | $52,831 | $9,071 | $43,760 |
| 2021 | $5,514 | $46,609 | $8,251 | $38,358 |
| 2020 | $5,343 | $44,712 | $8,251 | $36,461 |
| 2019 | $5,129 | $42,895 | $6,883 | $36,012 |
| 2018 | $5,301 | $43,976 | $6,883 | $37,093 |
| 2017 | $4,951 | $39,790 | $6,247 | $33,543 |
| 2016 | $4,822 | $38,272 | $5,993 | $32,279 |
| 2015 | $4,504 | $35,984 | $5,993 | $29,991 |
| 2013 | -- | $32,614 | $5,993 | $26,621 |
Source: Public Records
Map
Nearby Homes
- 13204 W 85th Ct
- 12908 W 84th St
- 13212 W 84th St
- 8221 Noland Rd
- 12525 W 85th Terrace
- 8545 Westgate St
- 8740 Park St
- 12100 W 82nd Terrace
- 7920 Gillette St
- 13001 W 78th Terrace
- 7908 Park St
- 13403 W 78th Place
- 12201 W 79th Terrace
- 8058 Colony Ln
- 12212 W 79th Terrace
- 8645 Greenwood Ln
- 7808 Long Ave
- 13408 W 78th Terrace
- 8362 Oakview Cir
- 8041 Acuff Ln
- 8500 Richards Rd
- 13103 W 84th St
- 8517 Hauser Ct
- 8523 Hauser Ct
- 8529 Hauser Ct
- 13107 W 84th St
- 8511 Hauser Ct
- 8535 Hauser Ct
- 8504 Richards Rd
- 8417 Richards Rd
- 8501 Richards Rd
- 8537 Hauser Ct
- 8413 Richards Rd
- 8567 Hauser Ct
- 13202 W 85th St
- 8505 Richards Rd
- 8569 Hauser Ct
- 8409 Richards Rd
- 8508 Richards Rd
- 8334 Richards Rd
Your Personal Tour Guide
Ask me questions while you tour the home.