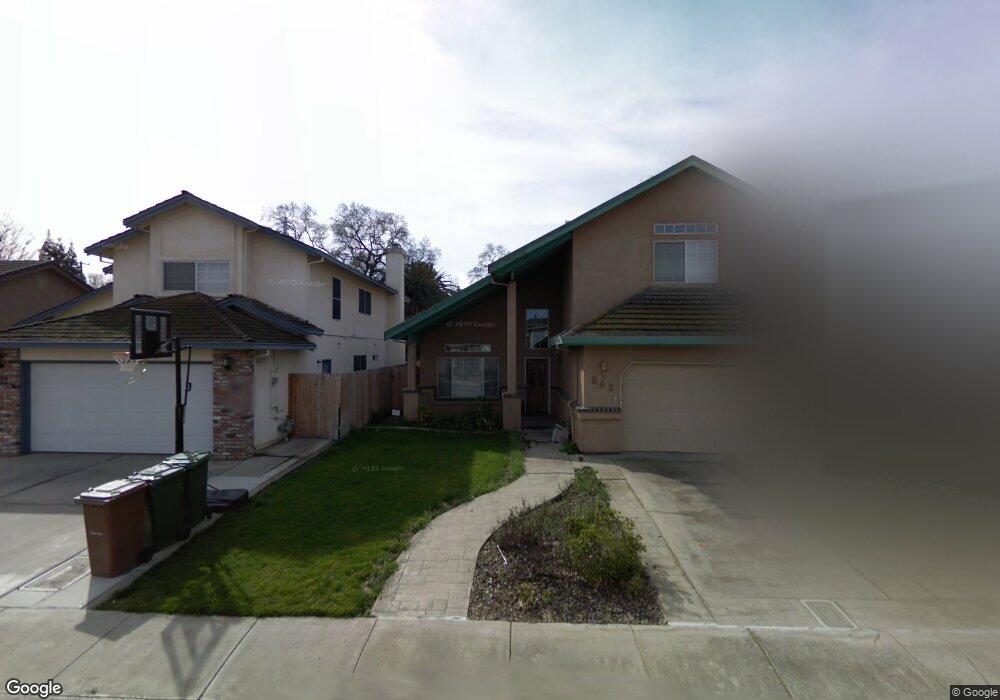
842 Woods St Woodbridge, CA 95258
Estimated Value: $550,000 - $640,000
3
Beds
3
Baths
2,289
Sq Ft
$263/Sq Ft
Est. Value
About This Home
This home is located at 842 Woods St, Woodbridge, CA 95258 and is currently estimated at $601,547, approximately $262 per square foot. 842 Woods St is a home located in San Joaquin County with nearby schools including Woodbridge Elementary School, Millswood Middle School, and Lodi High School.
Ownership History
Date
Name
Owned For
Owner Type
Purchase Details
Closed on
Sep 20, 2018
Sold by
Bruce Robet and Bruce Diana
Bought by
Bruce Robet and Bruce Diana
Current Estimated Value
Purchase Details
Closed on
Feb 2, 2011
Sold by
Smith Conley Diana G
Bought by
Smith Conley Diana G and The Diana G Smith Conley Revoc
Purchase Details
Closed on
Jun 18, 2002
Sold by
Perdue Luther D and Perdue Otha M
Bought by
Smith Conley Diana G
Home Financials for this Owner
Home Financials are based on the most recent Mortgage that was taken out on this home.
Original Mortgage
$154,000
Interest Rate
6.52%
Purchase Details
Closed on
Aug 20, 1998
Sold by
Snider Kevin C and Snider Sara J
Bought by
Perdue Luther D and Perdue Otha M
Home Financials for this Owner
Home Financials are based on the most recent Mortgage that was taken out on this home.
Original Mortgage
$132,000
Interest Rate
6.91%
Create a Home Valuation Report for This Property
The Home Valuation Report is an in-depth analysis detailing your home's value as well as a comparison with similar homes in the area
Home Values in the Area
Average Home Value in this Area
Purchase History
| Date | Buyer | Sale Price | Title Company |
|---|---|---|---|
| Bruce Robet | -- | None Available | |
| Bruce Robert | -- | None Available | |
| Smith Conley Diana G | -- | None Available | |
| Smith Conley Diana G | $240,000 | Alliance Title Company | |
| Perdue Luther D | $165,000 | Fidelity National Title |
Source: Public Records
Mortgage History
| Date | Status | Borrower | Loan Amount |
|---|---|---|---|
| Previous Owner | Smith Conley Diana G | $154,000 | |
| Previous Owner | Perdue Luther D | $132,000 |
Source: Public Records
Tax History Compared to Growth
Tax History
| Year | Tax Paid | Tax Assessment Tax Assessment Total Assessment is a certain percentage of the fair market value that is determined by local assessors to be the total taxable value of land and additions on the property. | Land | Improvement |
|---|---|---|---|---|
| 2025 | $5,114 | $347,430 | $102,822 | $244,608 |
| 2024 | $4,884 | $340,618 | $100,806 | $239,812 |
| 2023 | $4,638 | $333,940 | $98,830 | $235,110 |
| 2022 | $4,477 | $327,393 | $96,893 | $230,500 |
| 2021 | $4,506 | $320,975 | $94,994 | $225,981 |
| 2020 | $4,134 | $317,684 | $94,020 | $223,664 |
| 2019 | $4,033 | $311,456 | $92,177 | $219,279 |
| 2018 | $3,980 | $305,350 | $90,370 | $214,980 |
| 2017 | $3,899 | $299,364 | $88,599 | $210,765 |
| 2016 | $3,663 | $293,496 | $86,862 | $206,634 |
| 2014 | $3,541 | $283,427 | $83,882 | $199,545 |
Source: Public Records
Map
Nearby Homes
- 19014 Pebble Run
- 844 Cypress Run
- 2439 Inglewood Dr
- 493 Carolina St
- 2401 Eilers Ln Unit 1003
- 2401 Eilers Ln Unit 304
- 19036 N Augusta St
- 2300 Eilers Ln
- 19340 Wilderness Way
- 2400 Eilers Ln Unit 1703
- 2400 Eilers Ln Unit 1906
- 2400 Eilers Ln Unit 1607
- 2355 Woodlake Cir
- 19250 N Lower Sacramento Rd Unit 4
- 19250 N Lower Sacramento Rd Unit 25
- 991 Harvest Crossing St
- 1111 Brighton Way
- 2670 Manza Ct
- 2662 Veneto Ct
- 2408 Tejon St