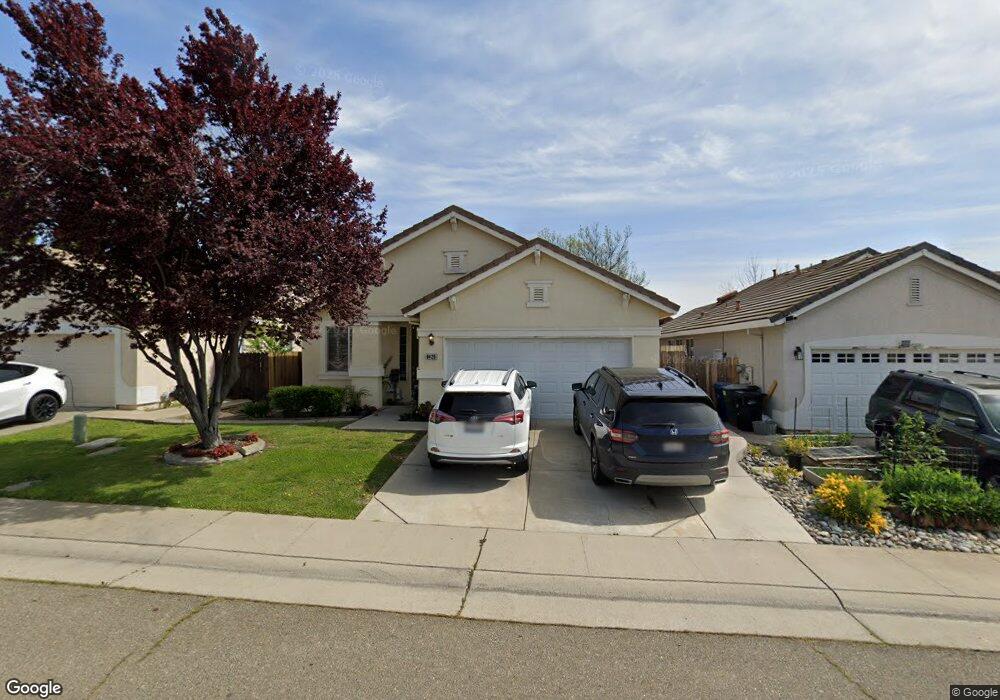
8420 Sundrop Way Antelope, CA 95843
Estimated Value: $438,000 - $508,000
4
Beds
2
Baths
1,474
Sq Ft
$330/Sq Ft
Est. Value
About This Home
This home is located at 8420 Sundrop Way, Antelope, CA 95843 and is currently estimated at $486,208, approximately $329 per square foot. 8420 Sundrop Way is a home located in Sacramento County with nearby schools including Creekview Ranch and Antelope High School.
Ownership History
Date
Name
Owned For
Owner Type
Purchase Details
Closed on
May 5, 2009
Sold by
Federal National Mortgage Association
Bought by
Jeffers Eugene C and Jeffers Lisa
Current Estimated Value
Home Financials for this Owner
Home Financials are based on the most recent Mortgage that was taken out on this home.
Original Mortgage
$216,015
Outstanding Balance
$135,451
Interest Rate
4.71%
Mortgage Type
FHA
Estimated Equity
$350,757
Purchase Details
Closed on
Dec 12, 2008
Sold by
Maneely Stephen and Maneely Heather
Bought by
Fannie Mae and Federal National Mortgage Association
Purchase Details
Closed on
Feb 8, 2002
Sold by
Beazer Homes Holdings Corp
Bought by
Maneely Stephen and Maneely Heather
Home Financials for this Owner
Home Financials are based on the most recent Mortgage that was taken out on this home.
Original Mortgage
$179,340
Interest Rate
6.99%
Mortgage Type
FHA
Create a Home Valuation Report for This Property
The Home Valuation Report is an in-depth analysis detailing your home's value as well as a comparison with similar homes in the area
Home Values in the Area
Average Home Value in this Area
Purchase History
| Date | Buyer | Sale Price | Title Company |
|---|---|---|---|
| Jeffers Eugene C | $220,000 | Lawyers Title Company | |
| Fannie Mae | $355,069 | None Available | |
| Maneely Stephen | $190,000 | Chicago Title Co |
Source: Public Records
Mortgage History
| Date | Status | Borrower | Loan Amount |
|---|---|---|---|
| Open | Jeffers Eugene C | $216,015 | |
| Previous Owner | Maneely Stephen | $179,340 |
Source: Public Records
Tax History
| Year | Tax Paid | Tax Assessment Tax Assessment Total Assessment is a certain percentage of the fair market value that is determined by local assessors to be the total taxable value of land and additions on the property. | Land | Improvement |
|---|---|---|---|---|
| 2025 | $3,087 | $283,289 | $109,450 | $173,839 |
| 2024 | $3,087 | $277,735 | $107,304 | $170,431 |
| 2023 | $3,865 | $272,290 | $105,200 | $167,090 |
| 2022 | $3,846 | $266,952 | $103,138 | $163,814 |
| 2021 | $3,840 | $261,718 | $101,116 | $160,602 |
| 2020 | $4,767 | $259,036 | $100,080 | $158,956 |
| 2019 | $3,731 | $253,958 | $98,118 | $155,840 |
| 2018 | $3,605 | $248,980 | $96,195 | $152,785 |
| 2017 | $3,544 | $244,099 | $94,309 | $149,790 |
| 2016 | $3,452 | $239,313 | $92,460 | $146,853 |
| 2015 | $3,384 | $235,720 | $91,072 | $144,648 |
| 2014 | $3,322 | $231,104 | $89,289 | $141,815 |
Source: Public Records
Map
Nearby Homes
- 8500 Grey Iron Ct
- 8300 White Spruce Dr
- 8226 Windmill Oaks Place
- 8279 Ghislaine Way
- 8215 Gold Sierra Ct
- 8020 Ivory Peak Way
- 9670 Canopy Tree St
- 8013 Ivory Peak Way
- 5806 Cerulean Hill Way
- 8009 Ivory Peak Way
- 8012 Ivory Peak Way
- 5810 Cerulean Hill Way
- 5807 Cerulean Hill Way
- 8005 Ivory Peak Way
- 8008 Ivory Peak Way
- 5814 Cerulean Hill Way
- 8001 Ivory Peak Way
- 8004 Ivory Peak Way
- 5818 Cerulean Hill Way
- 5819 Cerulean Hill Way
- 8416 Sundrop Way
- 8424 Sundrop Way
- 8412 Sundrop Way
- 8421 Pinyon Pine Place
- 8417 Pinyon Pine Place
- 8425 Pinyon Pine Place
- 8413 Pinyon Pine Place
- 8408 Sundrop Way
- 8421 Sundrop Way
- 8417 Sundrop Way
- 8425 Sundrop Way
- 8400 Arrowroot Cir
- 8409 Sundrop Way
- 8409 Pinyon Pine Place
- 8404 Sundrop Way
- 8419 Oreilly Place
- 8401 Sundrop Way
- 5708 Great Valley Dr
- 8405 Pinyon Pine Place
- 8400 Sundrop Way
Your Personal Tour Guide
Ask me questions while you tour the home.