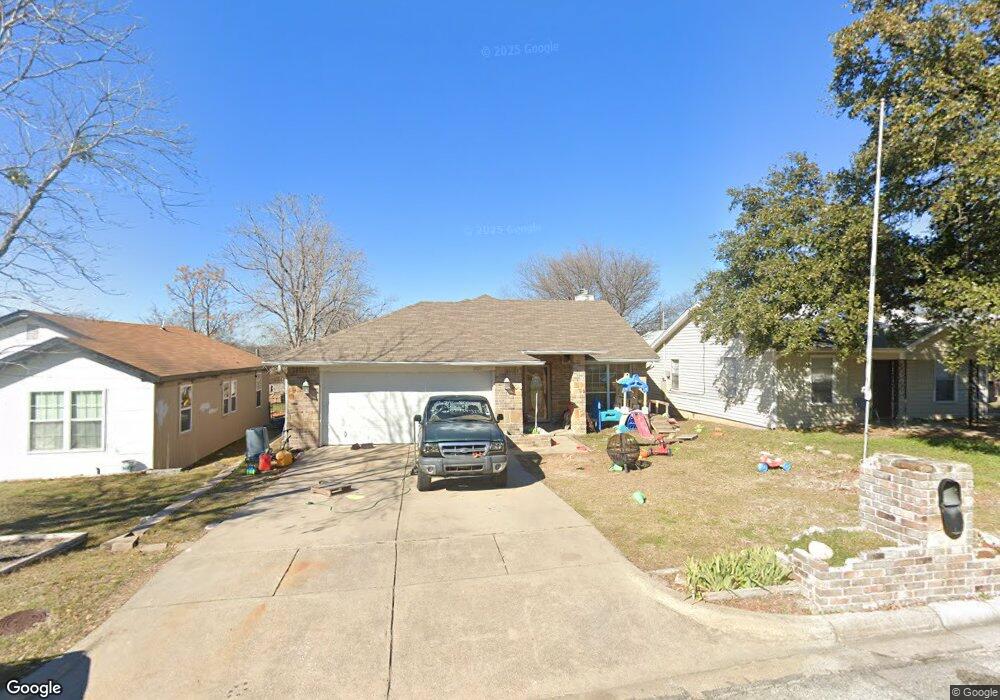
8424 Whitney Dr Fort Worth, TX 76108
Estimated Value: $251,000 - $262,760
3
Beds
2
Baths
1,407
Sq Ft
$182/Sq Ft
Est. Value
About This Home
This home is located at 8424 Whitney Dr, Fort Worth, TX 76108 and is currently estimated at $256,440, approximately $182 per square foot. 8424 Whitney Dr is a home located in Tarrant County with nearby schools including West Elementary School, Brewer Middle School, and Tannahill Intermediate School.
Ownership History
Date
Name
Owned For
Owner Type
Purchase Details
Closed on
Nov 3, 2021
Sold by
John Rodney and John Susan
Bought by
John Ryan Hale
Current Estimated Value
Home Financials for this Owner
Home Financials are based on the most recent Mortgage that was taken out on this home.
Original Mortgage
$133,950
Outstanding Balance
$122,553
Interest Rate
2.88%
Mortgage Type
New Conventional
Estimated Equity
$133,887
Purchase Details
Closed on
Oct 23, 2015
Sold by
Murray Paul W and Murray Janet G
Bought by
Murray Paul Womble and Murray Janet Gale
Purchase Details
Closed on
Aug 14, 2002
Sold by
Murray Paul W and Murray Janet G
Bought by
John Rodney
Home Financials for this Owner
Home Financials are based on the most recent Mortgage that was taken out on this home.
Original Mortgage
$5,625
Interest Rate
6.48%
Create a Home Valuation Report for This Property
The Home Valuation Report is an in-depth analysis detailing your home's value as well as a comparison with similar homes in the area
Home Values in the Area
Average Home Value in this Area
Purchase History
| Date | Buyer | Sale Price | Title Company |
|---|---|---|---|
| John Ryan Hale | -- | Providence Title Company | |
| Murray Paul Womble | -- | Attorney | |
| John Rodney | -- | First American Title Co |
Source: Public Records
Mortgage History
| Date | Status | Borrower | Loan Amount |
|---|---|---|---|
| Open | John Ryan Hale | $133,950 | |
| Previous Owner | John Rodney | $5,625 |
Source: Public Records
Tax History Compared to Growth
Tax History
| Year | Tax Paid | Tax Assessment Tax Assessment Total Assessment is a certain percentage of the fair market value that is determined by local assessors to be the total taxable value of land and additions on the property. | Land | Improvement |
|---|---|---|---|---|
| 2025 | $4,234 | $267,270 | $32,855 | $234,415 |
| 2024 | $4,234 | $267,270 | $32,855 | $234,415 |
| 2023 | $5,453 | $268,388 | $32,855 | $235,533 |
| 2022 | $5,646 | $208,489 | $25,000 | $183,489 |
| 2021 | $4,337 | $193,874 | $25,000 | $168,874 |
| 2020 | $3,972 | $173,669 | $25,000 | $148,669 |
| 2019 | $3,748 | $174,366 | $25,000 | $149,366 |
| 2018 | $2,847 | $118,459 | $12,000 | $106,459 |
| 2017 | $3,147 | $135,239 | $12,000 | $123,239 |
| 2016 | $2,861 | $128,041 | $12,000 | $116,041 |
| 2015 | $2,202 | $89,000 | $10,000 | $79,000 |
| 2014 | $2,202 | $89,000 | $10,000 | $79,000 |
Source: Public Records
Map
Nearby Homes
- 8437 Redonda St
- 800 Pemberton St
- 501 Pemberton St
- 8500 Wyatt Dr
- 8354 Sussex St
- 8400 Wyatt Dr
- 8528 Pemberton Ct
- 501 Allencrest Dr
- 809 Mirike Dr
- 8316 Sussex St
- 8508 Michael St
- 8232 Redonda St
- 411 S Las Vegas Trail
- 301 Mirike Dr
- 409 S Las Vegas Trail
- 407 S Las Vegas Trail
- 405 S Las Vegas Trail
- 428 S Las Vegas Trail
- 8203 Delmar St
- 508 Grant Cir
- 8420 Whitney Dr
- 8430 Whitney Dr
- 8419 Redonda St
- 8418 Whitney Dr
- 8417 Redonda St
- 8432 Whitney Dr
- 8413 Redonda St
- 8427 Whitney Dr
- 8423 Whitney Dr
- 8416 Whitney Dr
- 8434 Whitney Dr
- 8409 Redonda St
- 8419 Whitney Dr
- 8429 Whitney Dr
- 523 Pemberton Dr
- 523 Pemberton Dr
- 8412 Whitney Dr
- 8425 Pemberton Ct
- 8405 Redonda St
- 525 Pemberton Dr