8429 Spring Desert Place Unit C Rancho Cucamonga, CA 91730
Estimated Value: $461,000 - $488,809
2
Beds
3
Baths
1,110
Sq Ft
$429/Sq Ft
Est. Value
About This Home
This home is located at 8429 Spring Desert Place Unit C, Rancho Cucamonga, CA 91730 and is currently estimated at $476,452, approximately $429 per square foot. 8429 Spring Desert Place Unit C is a home located in San Bernardino County with nearby schools including Cucamonga Elementary, Rancho Cucamonga Middle, and Chaffey High School.
Ownership History
Date
Name
Owned For
Owner Type
Purchase Details
Closed on
Jun 10, 2023
Sold by
Rincon Alfredo and Rincon Eva
Bought by
Purepechas Revocable Living Trust
Current Estimated Value
Purchase Details
Closed on
May 23, 2002
Sold by
Krzeminski Stanley J
Bought by
Rincon Alfredo and Rincon Eva
Home Financials for this Owner
Home Financials are based on the most recent Mortgage that was taken out on this home.
Original Mortgage
$119,200
Interest Rate
6.74%
Purchase Details
Closed on
Aug 19, 1998
Sold by
Hud
Bought by
Krzeminski Stanley J and Krzeminski Diana
Home Financials for this Owner
Home Financials are based on the most recent Mortgage that was taken out on this home.
Original Mortgage
$82,913
Interest Rate
6.93%
Mortgage Type
FHA
Purchase Details
Closed on
Mar 12, 1998
Sold by
Alliance Mtg Company
Bought by
Hud
Purchase Details
Closed on
Mar 9, 1998
Sold by
Goodwin Jeffrey J
Bought by
Alliance Mtg Company
Create a Home Valuation Report for This Property
The Home Valuation Report is an in-depth analysis detailing your home's value as well as a comparison with similar homes in the area
Home Values in the Area
Average Home Value in this Area
Purchase History
| Date | Buyer | Sale Price | Title Company |
|---|---|---|---|
| Purepechas Revocable Living Trust | -- | None Listed On Document | |
| Rincon Alfredo | $149,000 | Orange Coast Title | |
| Krzeminski Stanley J | $83,500 | Northern Counties Title Co | |
| Hud | -- | First Southwestern Title Co | |
| Alliance Mtg Company | $100,117 | First Southwestern Title Co |
Source: Public Records
Mortgage History
| Date | Status | Borrower | Loan Amount |
|---|---|---|---|
| Previous Owner | Rincon Alfredo | $119,200 | |
| Previous Owner | Krzeminski Stanley J | $82,913 |
Source: Public Records
Tax History Compared to Growth
Tax History
| Year | Tax Paid | Tax Assessment Tax Assessment Total Assessment is a certain percentage of the fair market value that is determined by local assessors to be the total taxable value of land and additions on the property. | Land | Improvement |
|---|---|---|---|---|
| 2025 | $2,303 | $220,121 | $77,044 | $143,077 |
| 2024 | $2,303 | $215,805 | $75,533 | $140,272 |
| 2023 | $2,251 | $211,574 | $74,052 | $137,522 |
| 2022 | $2,210 | $207,425 | $72,600 | $134,825 |
| 2021 | $2,190 | $203,357 | $71,176 | $132,181 |
| 2020 | $2,151 | $201,272 | $70,446 | $130,826 |
| 2019 | $2,139 | $197,326 | $69,065 | $128,261 |
| 2018 | $2,086 | $193,457 | $67,711 | $125,746 |
| 2017 | $2,012 | $189,663 | $66,383 | $123,280 |
| 2016 | $1,985 | $185,944 | $65,081 | $120,863 |
| 2015 | $1,971 | $183,151 | $64,103 | $119,048 |
| 2014 | $1,912 | $179,563 | $62,847 | $116,716 |
Source: Public Records
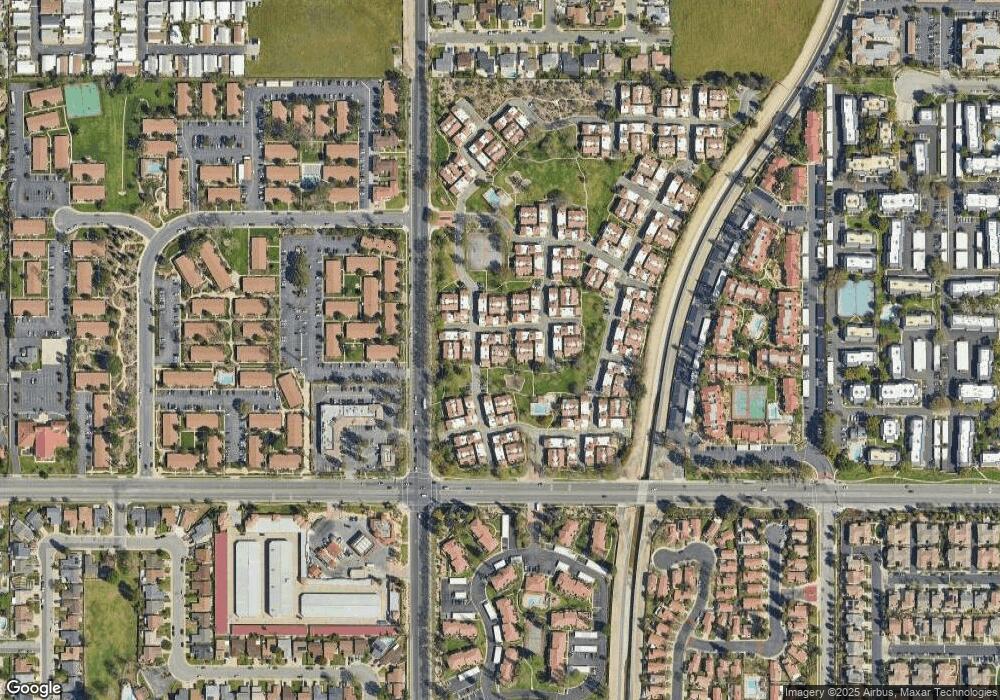
Map
Nearby Homes
- 8430 Spring Desert Place Unit B
- 8426 Western Trail Place Unit E
- 8401 Sunset Trail Place Unit E
- 8541 Creekside Place
- 10312 Sparkling Dr Unit 3
- 8530 Willow Dr
- 10349 Cooks Dr Unit 2
- 10382 Sparkling Dr Unit 1
- 8656 Harvest Place Unit 75
- 9999 Foothill Blvd Unit 160
- 9999 Foothill Blvd Unit 94
- 1 Hoffman Rd
- 10108 24th St
- 10026 10026 Foothill Blvd
- 10312 24th St
- 10353 25th St
- 10322 24th St
- 10113 Dorset St
- 10288 Effen St
- 8252 Malachite Ave
- 8429 Spring Desert Place
- 8429 Spring Desert Place Unit G
- 8429 Spring Desert Place Unit 55
- 8429 Spring Desert Place Unit B
- 8429 Spring Desert Place Unit A
- 8429 Spring Desert Place Unit H
- 8429 Spring Desert Place Unit E
- 8429 Spring Desert Place Unit F
- 8429 Spring Desert Place Unit D
- 8426 Western Trail Place
- 8426 Western Trail Place Unit B
- 8426 Western Trail Place Unit A
- 8426 Western Trail Place Unit H
- 8426 Western Trail Place Unit G
- 8426 Western Trail Place Unit F
- 8426 Western Trail Place Unit D
- 8426 Western Trail Place Unit C
- 8412 Western Trail Place Unit C
- 8412 Western Trail Place
- 8412 Western Trail Place Unit 141