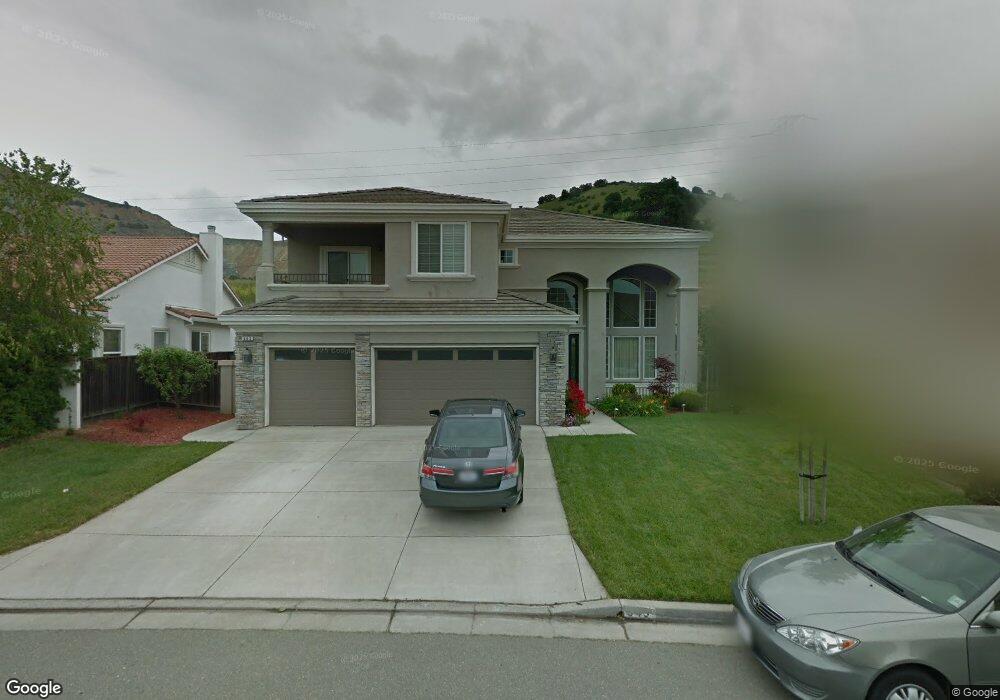
843 Deer Spring Cir Concord, CA 94521
The Highlands NeighborhoodEstimated Value: $1,408,638 - $1,533,000
5
Beds
4
Baths
3,169
Sq Ft
$465/Sq Ft
Est. Value
About This Home
This home is located at 843 Deer Spring Cir, Concord, CA 94521 and is currently estimated at $1,473,410, approximately $464 per square foot. 843 Deer Spring Cir is a home located in Contra Costa County with nearby schools including Highlands Elementary School, Mt. Diablo Elementary School, and Pine Hollow Middle School.
Ownership History
Date
Name
Owned For
Owner Type
Purchase Details
Closed on
Aug 20, 2012
Sold by
Zakrzewski Ted and Zakrzewski Martha
Bought by
Zakrzewski Ted and Zakrzewski Martha
Current Estimated Value
Home Financials for this Owner
Home Financials are based on the most recent Mortgage that was taken out on this home.
Original Mortgage
$288,247
Outstanding Balance
$45,856
Interest Rate
3.53%
Mortgage Type
New Conventional
Estimated Equity
$1,427,554
Purchase Details
Closed on
Jan 9, 2004
Sold by
West Coast Home Builders Inc
Bought by
Zakrzewski Ted and Zakrzewski Martha
Home Financials for this Owner
Home Financials are based on the most recent Mortgage that was taken out on this home.
Original Mortgage
$332,700
Interest Rate
6.02%
Mortgage Type
Purchase Money Mortgage
Create a Home Valuation Report for This Property
The Home Valuation Report is an in-depth analysis detailing your home's value as well as a comparison with similar homes in the area
Home Values in the Area
Average Home Value in this Area
Purchase History
| Date | Buyer | Sale Price | Title Company |
|---|---|---|---|
| Zakrzewski Ted | -- | North American Title Company | |
| Zakrzewski Ted | $734,500 | Old Republic Title |
Source: Public Records
Mortgage History
| Date | Status | Borrower | Loan Amount |
|---|---|---|---|
| Open | Zakrzewski Ted | $288,247 | |
| Closed | Zakrzewski Ted | $332,700 | |
| Closed | Zakrzewski Ted | $150,000 |
Source: Public Records
Tax History
| Year | Tax Paid | Tax Assessment Tax Assessment Total Assessment is a certain percentage of the fair market value that is determined by local assessors to be the total taxable value of land and additions on the property. | Land | Improvement |
|---|---|---|---|---|
| 2025 | $12,473 | $1,045,711 | $469,183 | $576,528 |
| 2024 | $11,956 | $1,025,208 | $459,984 | $565,224 |
| 2023 | $11,956 | $1,005,107 | $450,965 | $554,142 |
| 2022 | $11,816 | $985,400 | $442,123 | $543,277 |
| 2021 | $11,541 | $966,079 | $433,454 | $532,625 |
| 2019 | $11,332 | $937,427 | $420,599 | $516,828 |
| 2018 | $10,911 | $919,047 | $412,352 | $506,695 |
| 2017 | $10,429 | $889,000 | $398,871 | $490,129 |
| 2016 | $10,103 | $865,500 | $388,327 | $477,173 |
| 2015 | $9,680 | $822,000 | $368,810 | $453,190 |
| 2014 | $9,124 | $769,000 | $345,030 | $423,970 |
Source: Public Records
Map
Nearby Homes
- 5408 Oakstone Ct
- 5391 Fernbank Dr
- 5350 Fernbank Dr Unit 1
- 974 Rosehedge Ct
- 995 Rosehedge Ct
- 1109 Vista Point Ln
- 5535 Merritt Dr
- 1271 Kentucky Dr
- 1297 Kansas Cir
- 1346 Montana Dr
- 5468 Roundtree Dr Unit C
- 5506 Nebraska Dr
- 5555 Maryland Dr
- 5817 Mitchell Canyon Ct
- 5434 Roundtree Ct Unit A
- 5492 Roundtree Dr Unit A
- 5722 Roanwood Way
- 1120 Kenwal Rd Unit C
- 5451 Roundtree Place
- 1195 Kenwal Rd Unit B
- 839 Deer Spring Cir
- 845 Deer Spring Cir
- 847 Deer Spring Cir
- 842 Deer Spring Cir
- 837 Deer Spring Cir
- 840 Deer Spring Cir
- 846 Deer Spring Cir
- 849 Deer Spring Cir
- 835 Deer Spring Cir
- 850 Deer Spring Cir
- 5430 Woodhollow Ct
- 5412 Oakstone Ct
- 833 Deer Spring Cir
- 832 Deer Spring Cir
- 854 Deer Spring Cir
- 831 Deer Spring Cir
- 5431 Woodhollow Ct
- 5410 Oakstone Ct
- 5424 Woodhollow Ct
- 830 Deer Spring Cir
Your Personal Tour Guide
Ask me questions while you tour the home.