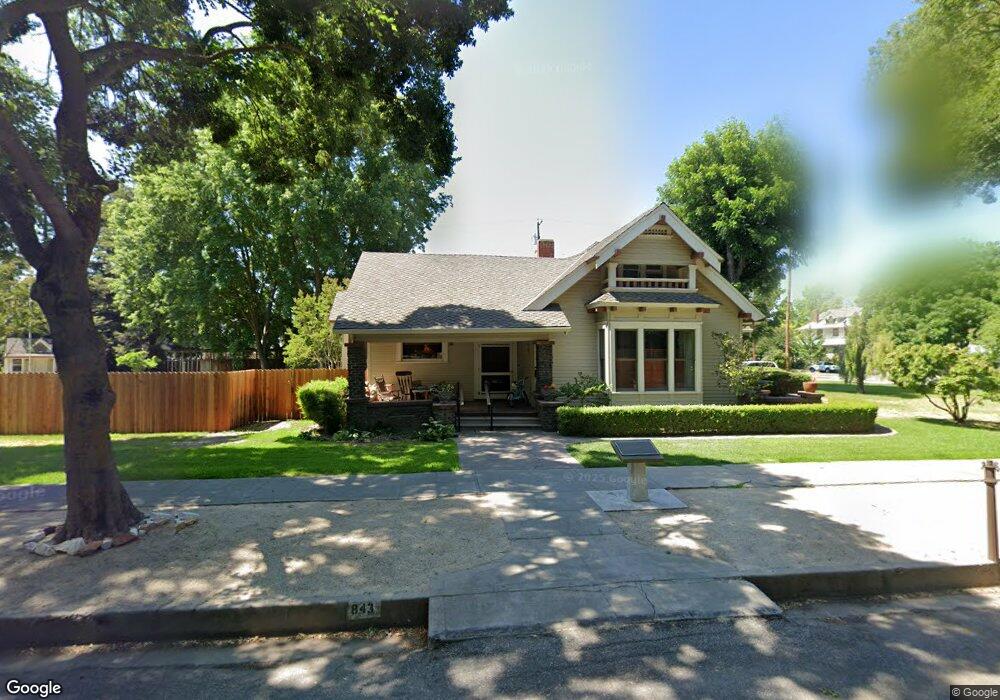
843 Jay St Colusa, CA 95932
Estimated Value: $489,000 - $574,000
4
Beds
3
Baths
2,673
Sq Ft
$196/Sq Ft
Est. Value
About This Home
This home is located at 843 Jay St, Colusa, CA 95932 and is currently estimated at $524,857, approximately $196 per square foot. 843 Jay St is a home located in Colusa County with nearby schools including James M. Burchfield Primary School, George T. Egling Middle School, and Colusa High School.
Ownership History
Date
Name
Owned For
Owner Type
Purchase Details
Closed on
Sep 29, 2021
Sold by
Welcome James A and Welcome James Alfred
Bought by
Welcome James Alfred and Welcome Mire
Current Estimated Value
Home Financials for this Owner
Home Financials are based on the most recent Mortgage that was taken out on this home.
Original Mortgage
$313,707
Outstanding Balance
$286,072
Interest Rate
2.8%
Mortgage Type
New Conventional
Estimated Equity
$238,785
Purchase Details
Closed on
Jun 28, 2018
Sold by
Welcome Mire
Bought by
Welcome James A
Home Financials for this Owner
Home Financials are based on the most recent Mortgage that was taken out on this home.
Original Mortgage
$320,000
Interest Rate
4.6%
Mortgage Type
New Conventional
Purchase Details
Closed on
Jun 19, 2018
Sold by
Krause Raymond A and Krause Donna M
Bought by
Welcome Jamkes A
Home Financials for this Owner
Home Financials are based on the most recent Mortgage that was taken out on this home.
Original Mortgage
$320,000
Interest Rate
4.6%
Mortgage Type
New Conventional
Create a Home Valuation Report for This Property
The Home Valuation Report is an in-depth analysis detailing your home's value as well as a comparison with similar homes in the area
Home Values in the Area
Average Home Value in this Area
Purchase History
| Date | Buyer | Sale Price | Title Company |
|---|---|---|---|
| Welcome James Alfred | -- | Servicelink | |
| Welcome James A | -- | First American Title Co | |
| Welcome Jamkes A | $400,000 | First American Title Co |
Source: Public Records
Mortgage History
| Date | Status | Borrower | Loan Amount |
|---|---|---|---|
| Open | Welcome James Alfred | $313,707 | |
| Closed | Welcome James A | $320,000 |
Source: Public Records
Tax History Compared to Growth
Tax History
| Year | Tax Paid | Tax Assessment Tax Assessment Total Assessment is a certain percentage of the fair market value that is determined by local assessors to be the total taxable value of land and additions on the property. | Land | Improvement |
|---|---|---|---|---|
| 2025 | $4,311 | $403,925 | $51,200 | $352,725 |
| 2024 | $4,311 | $396,006 | $50,197 | $345,809 |
| 2023 | $4,134 | $388,242 | $49,213 | $339,029 |
| 2022 | $4,132 | $380,631 | $48,249 | $332,382 |
| 2021 | $3,956 | $373,168 | $47,303 | $325,865 |
| 2020 | $3,910 | $369,342 | $46,818 | $322,524 |
| 2019 | $3,887 | $362,100 | $45,900 | $316,200 |
| 2018 | $2,081 | $190,948 | $42,893 | $148,055 |
| 2017 | $2,058 | $187,204 | $42,052 | $145,152 |
| 2016 | $2,019 | $183,534 | $41,228 | $142,306 |
| 2015 | $1,984 | $180,778 | $40,609 | $140,169 |
| 2014 | $1,886 | $177,238 | $39,814 | $137,424 |
Source: Public Records
Map
Nearby Homes