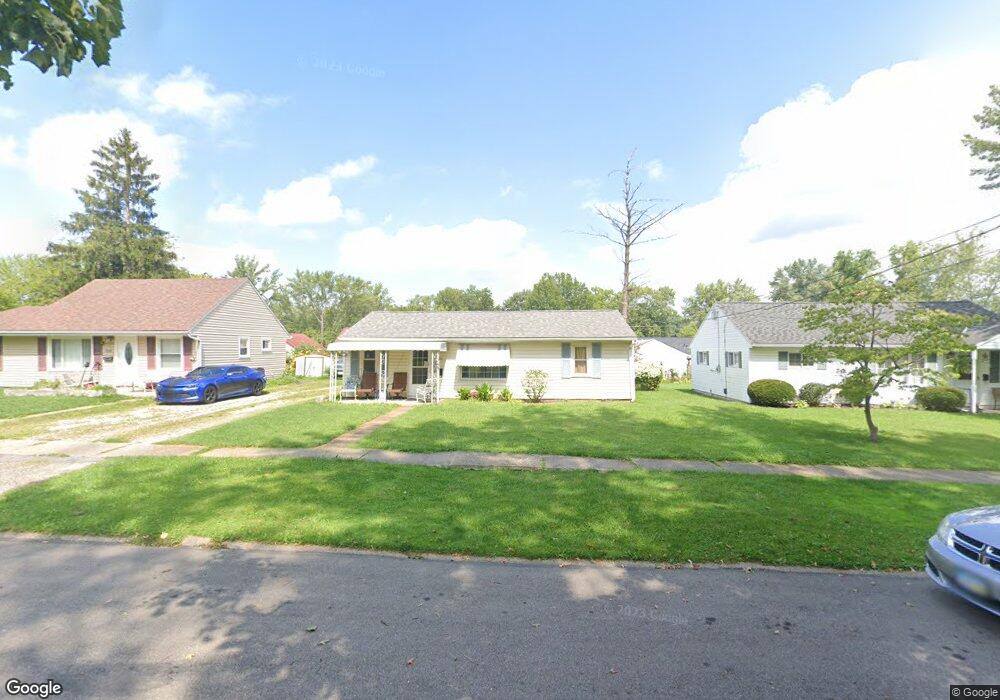
843 Oak St Elyria, OH 44035
Estimated Value: $126,000 - $142,000
3
Beds
1
Bath
912
Sq Ft
$148/Sq Ft
Est. Value
About This Home
This home is located at 843 Oak St, Elyria, OH 44035 and is currently estimated at $134,684, approximately $147 per square foot. 843 Oak St is a home located in Lorain County with nearby schools including Westwood Middle School, Elyria High School, and St Mary Elementary School.
Ownership History
Date
Name
Owned For
Owner Type
Purchase Details
Closed on
Jul 10, 2007
Sold by
Krugman Robert Clare and Krugman Robert C
Bought by
Burnsworth Sullivan A
Current Estimated Value
Home Financials for this Owner
Home Financials are based on the most recent Mortgage that was taken out on this home.
Original Mortgage
$76,000
Outstanding Balance
$47,179
Interest Rate
6.37%
Mortgage Type
Purchase Money Mortgage
Estimated Equity
$87,505
Create a Home Valuation Report for This Property
The Home Valuation Report is an in-depth analysis detailing your home's value as well as a comparison with similar homes in the area
Home Values in the Area
Average Home Value in this Area
Purchase History
| Date | Buyer | Sale Price | Title Company |
|---|---|---|---|
| Burnsworth Sullivan A | $76,000 | Chicago Title Insurance Co |
Source: Public Records
Mortgage History
| Date | Status | Borrower | Loan Amount |
|---|---|---|---|
| Open | Burnsworth Sullivan A | $76,000 |
Source: Public Records
Tax History
| Year | Tax Paid | Tax Assessment Tax Assessment Total Assessment is a certain percentage of the fair market value that is determined by local assessors to be the total taxable value of land and additions on the property. | Land | Improvement |
|---|---|---|---|---|
| 2024 | $1,527 | $32,274 | $7,630 | $24,644 |
| 2023 | $1,413 | $25,774 | $8,225 | $17,549 |
| 2022 | $1,400 | $25,774 | $8,225 | $17,549 |
| 2021 | $1,436 | $25,774 | $8,225 | $17,549 |
| 2020 | $1,317 | $21,520 | $6,870 | $14,650 |
| 2019 | $1,309 | $21,520 | $6,870 | $14,650 |
| 2018 | $1,311 | $21,520 | $6,870 | $14,650 |
| 2017 | $1,267 | $19,940 | $7,250 | $12,690 |
| 2016 | $1,251 | $19,940 | $7,250 | $12,690 |
| 2015 | $1,171 | $19,940 | $7,250 | $12,690 |
| 2014 | $1,218 | $20,990 | $7,630 | $13,360 |
| 2013 | $1,207 | $20,990 | $7,630 | $13,360 |
Source: Public Records
Map
Nearby Homes
Your Personal Tour Guide
Ask me questions while you tour the home.