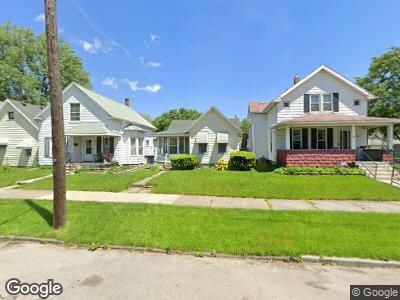
843 Rogers St Toledo, OH 43605
East Toledo NeighborhoodEstimated Value: $46,000 - $73,000
2
Beds
1
Bath
861
Sq Ft
$69/Sq Ft
Est. Value
About This Home
This home is located at 843 Rogers St, Toledo, OH 43605 and is currently estimated at $59,577, approximately $69 per square foot. 843 Rogers St is a home located in Lucas County with nearby schools including East Broadway Elementary School, Waite High School, and Toledo Preparatory Academy.
Ownership History
Date
Name
Owned For
Owner Type
Purchase Details
Closed on
Mar 16, 2005
Sold by
Fannie Mae
Bought by
Horman Brian and Brucker Horman Mary
Current Estimated Value
Purchase Details
Closed on
Oct 1, 2004
Sold by
Hague Paul E and Mortgage Electronic Registrati
Bought by
Federal National Mortgage Association
Purchase Details
Closed on
Mar 26, 1991
Sold by
Harris Norma D
Create a Home Valuation Report for This Property
The Home Valuation Report is an in-depth analysis detailing your home's value as well as a comparison with similar homes in the area
Home Values in the Area
Average Home Value in this Area
Purchase History
| Date | Buyer | Sale Price | Title Company |
|---|---|---|---|
| Horman Brian | $12,000 | Louisville Title Agency For | |
| Federal National Mortgage Association | $23,000 | -- | |
| -- | -- | -- |
Source: Public Records
Mortgage History
| Date | Status | Borrower | Loan Amount |
|---|---|---|---|
| Open | Horman Brian | $26,000 | |
| Previous Owner | Hague Paul E | $27,200 |
Source: Public Records
Tax History Compared to Growth
Tax History
| Year | Tax Paid | Tax Assessment Tax Assessment Total Assessment is a certain percentage of the fair market value that is determined by local assessors to be the total taxable value of land and additions on the property. | Land | Improvement |
|---|---|---|---|---|
| 2024 | $329 | $8,995 | $4,235 | $4,760 |
| 2023 | $598 | $7,665 | $3,745 | $3,920 |
| 2022 | $605 | $7,665 | $3,745 | $3,920 |
| 2021 | $608 | $7,665 | $3,745 | $3,920 |
| 2020 | $598 | $6,650 | $3,220 | $3,430 |
| 2019 | $593 | $6,650 | $3,220 | $3,430 |
| 2018 | $585 | $6,650 | $3,220 | $3,430 |
| 2017 | $612 | $6,510 | $3,150 | $3,360 |
| 2016 | $603 | $18,600 | $9,000 | $9,600 |
| 2015 | $594 | $18,600 | $9,000 | $9,600 |
| 2014 | $412 | $6,370 | $3,080 | $3,290 |
| 2013 | $412 | $6,370 | $3,080 | $3,290 |
Source: Public Records
Map
Nearby Homes