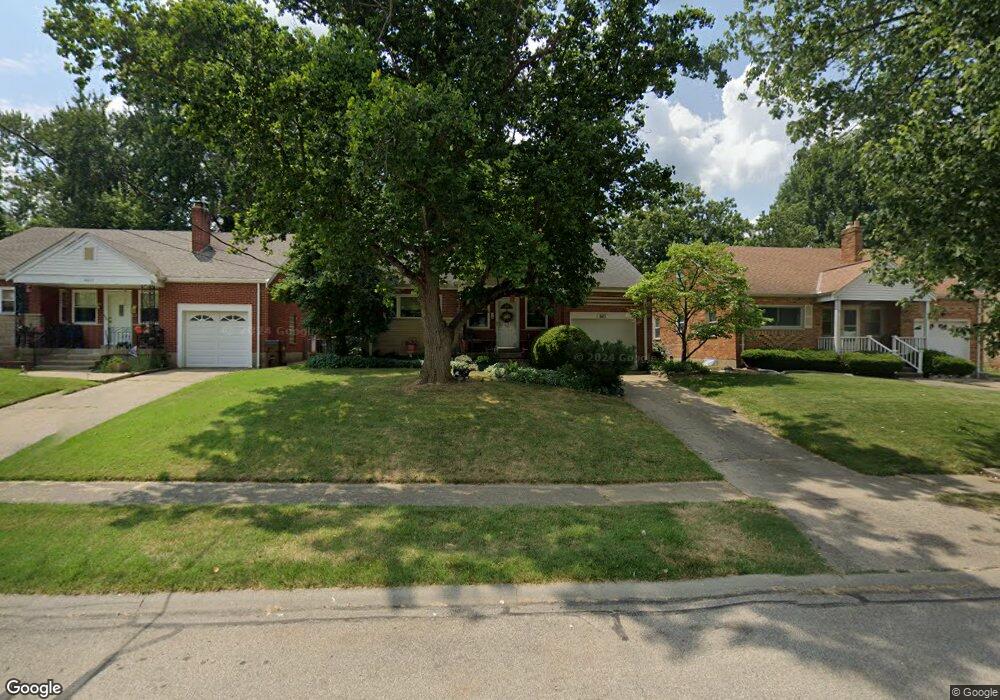
8431 Firshade Terrace Cincinnati, OH 45239
Estimated Value: $219,000 - $234,000
3
Beds
3
Baths
1,443
Sq Ft
$155/Sq Ft
Est. Value
About This Home
This home is located at 8431 Firshade Terrace, Cincinnati, OH 45239 and is currently estimated at $224,059, approximately $155 per square foot. 8431 Firshade Terrace is a home located in Hamilton County with nearby schools including White Oak Middle School, Colerain High School, and Our Lady of Grace Catholic School.
Ownership History
Date
Name
Owned For
Owner Type
Purchase Details
Closed on
Oct 31, 2006
Sold by
Taylor Deborah L and Taylor Debra L
Bought by
Baer Mary M
Current Estimated Value
Home Financials for this Owner
Home Financials are based on the most recent Mortgage that was taken out on this home.
Original Mortgage
$96,000
Interest Rate
6.21%
Mortgage Type
Unknown
Purchase Details
Closed on
Sep 4, 2001
Sold by
Taylor John N
Bought by
Taylor Deborah L and Taylor Debra L
Purchase Details
Closed on
Aug 27, 2001
Sold by
Taylor John N
Bought by
Taylor Debra L
Purchase Details
Closed on
Jul 23, 1997
Sold by
Moore Frank B and Moore Alvera W
Bought by
Taylor John N and Taylor Deborah L
Home Financials for this Owner
Home Financials are based on the most recent Mortgage that was taken out on this home.
Original Mortgage
$74,950
Interest Rate
7.81%
Create a Home Valuation Report for This Property
The Home Valuation Report is an in-depth analysis detailing your home's value as well as a comparison with similar homes in the area
Home Values in the Area
Average Home Value in this Area
Purchase History
| Date | Buyer | Sale Price | Title Company |
|---|---|---|---|
| Baer Mary M | $120,000 | Attorney | |
| Taylor Deborah L | -- | -- | |
| Taylor Debra L | -- | -- | |
| Taylor John N | $93,700 | -- |
Source: Public Records
Mortgage History
| Date | Status | Borrower | Loan Amount |
|---|---|---|---|
| Previous Owner | Baer Mary M | $96,000 | |
| Previous Owner | Taylor John N | $74,950 |
Source: Public Records
Tax History Compared to Growth
Tax History
| Year | Tax Paid | Tax Assessment Tax Assessment Total Assessment is a certain percentage of the fair market value that is determined by local assessors to be the total taxable value of land and additions on the property. | Land | Improvement |
|---|---|---|---|---|
| 2024 | $2,872 | $53,669 | $10,528 | $43,141 |
| 2023 | $2,890 | $53,669 | $10,528 | $43,141 |
| 2022 | $2,397 | $36,589 | $10,402 | $26,187 |
| 2021 | $2,422 | $36,589 | $10,402 | $26,187 |
| 2020 | $2,422 | $36,589 | $10,402 | $26,187 |
| 2019 | $2,094 | $29,509 | $8,390 | $21,119 |
| 2018 | $1,879 | $29,509 | $8,390 | $21,119 |
| 2017 | $1,781 | $29,509 | $8,390 | $21,119 |
| 2016 | $2,121 | $34,741 | $8,883 | $25,858 |
| 2015 | $2,141 | $34,741 | $8,883 | $25,858 |
| 2014 | $2,145 | $34,741 | $8,883 | $25,858 |
| 2013 | $2,042 | $34,741 | $8,883 | $25,858 |
Source: Public Records
Map
Nearby Homes
- 3474 Oakmeadow Ln
- 8344 Firshade Terrace
- 8323 Firshade Terrace
- 3369 W Galbraith Rd
- 3663 Sandralin Dr
- 3408 Rocker Dr
- 8747 Cheviot Rd
- 3277 Warfield Ave
- 3691 W Galbraith Rd
- 3464 Nandale Dr Unit 53
- 3701 W Galbraith Rd
- 8812 Carrousel Park Cir
- 3397 Nandale Dr
- 3937 Olde Savannah Dr Unit 3937
- 8530 Wuest Rd
- 7620 Cheviot Rd
- 3950 Olde Savannah Dr
- 3960 Olde Savannah Dr
- 3329 Alexis Rd
- 2953 Commodore Ln
- 8439 Firshade Terrace
- 8423 Firshade Terrace
- 8445 Firshade Terrace
- 8417 Firshade Terrace
- 8422 Coghill Ln
- 8430 Coghill Ln
- 8416 Coghill Ln
- 8453 Firshade Terrace
- 8409 Firshade Terrace
- 8438 Coghill Ln
- 8408 Coghill Ln
- 8444 Coghill Ln
- 8430 Firshade Terrace
- 8461 Firshade Terrace
- 8401 Firshade Terrace
- 8422 Firshade Terrace
- 8438 Firshade Terrace
- 8416 Firshade Terrace
- 8444 Firshade Terrace
- 8400 Coghill Ln