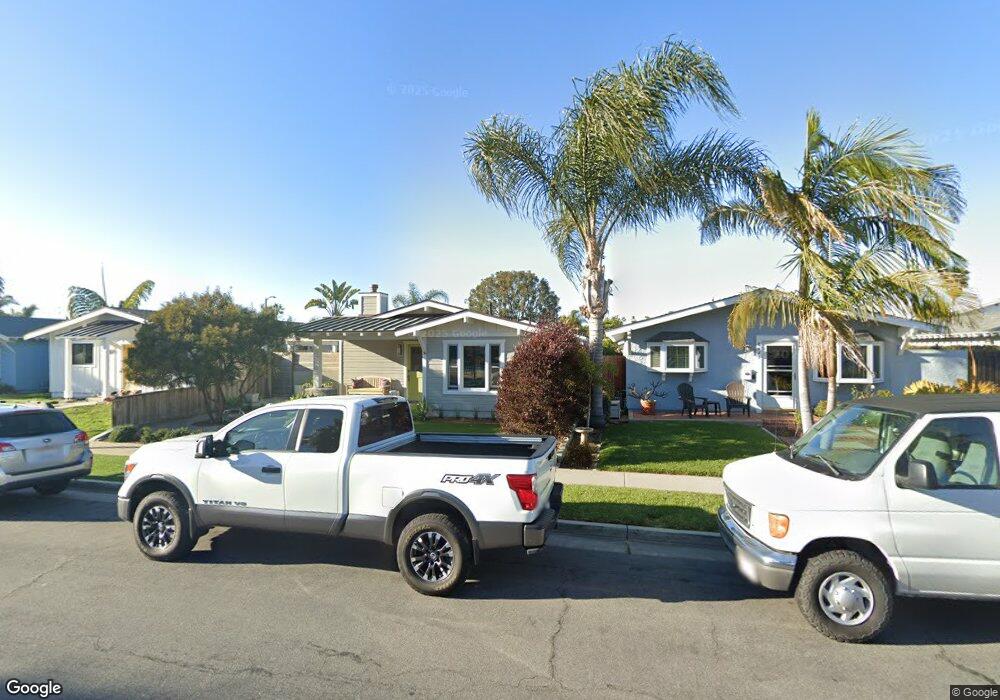
8431 Lomond Dr Huntington Beach, CA 92646
Southeast NeighborhoodEstimated Value: $968,000 - $1,327,000
3
Beds
2
Baths
1,374
Sq Ft
$853/Sq Ft
Est. Value
About This Home
This home is located at 8431 Lomond Dr, Huntington Beach, CA 92646 and is currently estimated at $1,171,491, approximately $852 per square foot. 8431 Lomond Dr is a home located in Orange County with nearby schools including S.A. Moffett Elementary School, Isaac L. Sowers Middle School, and Edison High School.
Ownership History
Date
Name
Owned For
Owner Type
Purchase Details
Closed on
Sep 23, 2021
Sold by
Oakley David R and Oakley Christina E
Bought by
Oakley David R and Oakley Christina E
Current Estimated Value
Home Financials for this Owner
Home Financials are based on the most recent Mortgage that was taken out on this home.
Original Mortgage
$400,000
Outstanding Balance
$363,970
Interest Rate
2.8%
Mortgage Type
New Conventional
Estimated Equity
$807,521
Purchase Details
Closed on
Sep 13, 2021
Sold by
Oakley David R and Oakley Christina E
Bought by
Oakley David R and Oakley Christina E
Home Financials for this Owner
Home Financials are based on the most recent Mortgage that was taken out on this home.
Original Mortgage
$400,000
Outstanding Balance
$363,970
Interest Rate
2.8%
Mortgage Type
New Conventional
Estimated Equity
$807,521
Purchase Details
Closed on
May 16, 2013
Sold by
Oakley David Robert and Oakley Christina
Bought by
Oakley David R and Oakley Christina E
Purchase Details
Closed on
Jul 9, 2012
Sold by
Pallack Harold Arthur
Bought by
Oakley David Robert and Oakley Christina
Create a Home Valuation Report for This Property
The Home Valuation Report is an in-depth analysis detailing your home's value as well as a comparison with similar homes in the area
Home Values in the Area
Average Home Value in this Area
Purchase History
| Date | Buyer | Sale Price | Title Company |
|---|---|---|---|
| Oakley David R | -- | Title Connect Inc | |
| Oakley David R | -- | Title Connect Inc | |
| Oakley David R | -- | Accommodation | |
| Oakley David Robert | $457,500 | First American Title Company |
Source: Public Records
Mortgage History
| Date | Status | Borrower | Loan Amount |
|---|---|---|---|
| Open | Oakley David R | $400,000 |
Source: Public Records
Tax History Compared to Growth
Tax History
| Year | Tax Paid | Tax Assessment Tax Assessment Total Assessment is a certain percentage of the fair market value that is determined by local assessors to be the total taxable value of land and additions on the property. | Land | Improvement |
|---|---|---|---|---|
| 2025 | $7,345 | $643,298 | $497,701 | $145,597 |
| 2024 | $7,345 | $630,685 | $487,942 | $142,743 |
| 2023 | $7,181 | $618,319 | $478,374 | $139,945 |
| 2022 | $6,993 | $606,196 | $468,995 | $137,201 |
| 2021 | $6,864 | $594,310 | $459,799 | $134,511 |
| 2020 | $6,819 | $588,217 | $455,085 | $133,132 |
| 2019 | $6,739 | $576,684 | $446,162 | $130,522 |
| 2018 | $6,636 | $565,377 | $437,414 | $127,963 |
| 2017 | $6,336 | $535,330 | $428,837 | $106,493 |
| 2016 | $6,057 | $524,834 | $420,429 | $104,405 |
| 2015 | $5,999 | $516,951 | $414,114 | $102,837 |
| 2014 | $5,835 | $503,247 | $406,002 | $97,245 |
Source: Public Records
Map
Nearby Homes
- 8438 Hibiscus Cir
- 21131 Greenboro Ln
- 21032 Shepherd Ln
- 8401 Atlanta Ave
- 8633 Portola Ct Unit 18G
- 21851 Newland St Unit 104
- 21851 Newland St Unit 255
- 21851 Newland St Unit 232
- 21851 Newland St Unit 44
- 21851 Newland St Unit 117
- 21851 Newland St Unit 109
- 21851 Newland St Unit 58
- 21851 Newland St Unit 279
- 21851 Newland St Unit 270
- 21851 Newland St Unit 147
- 21851 Newland St Unit 46
- 21851 Newland St Unit 209
- 21851 Newland St Unit 213
- 21851 Newland St Unit 45
- 21851 Newland St Unit 7
- 8441 Lomond Dr
- 8421 Lomond Dr
- 8447 Lomond Dr
- 8411 Lomond Dr
- 8449 Lomond Dr
- 8451 Lomond Dr
- 8401 Lomond Dr
- 8432 Doncaster Dr
- 8442 Doncaster Dr
- 8422 Doncaster Dr
- 8461 Lomond Dr
- 8391 Lomond Dr
- 8448 Doncaster Dr
- 8412 Doncaster Dr
- 8452 Doncaster Dr
- 8402 Doncaster Dr
- 8471 Lomond Dr
- 8462 Doncaster Dr
- 8392 Doncaster Dr
- 8409 Noelle Dr