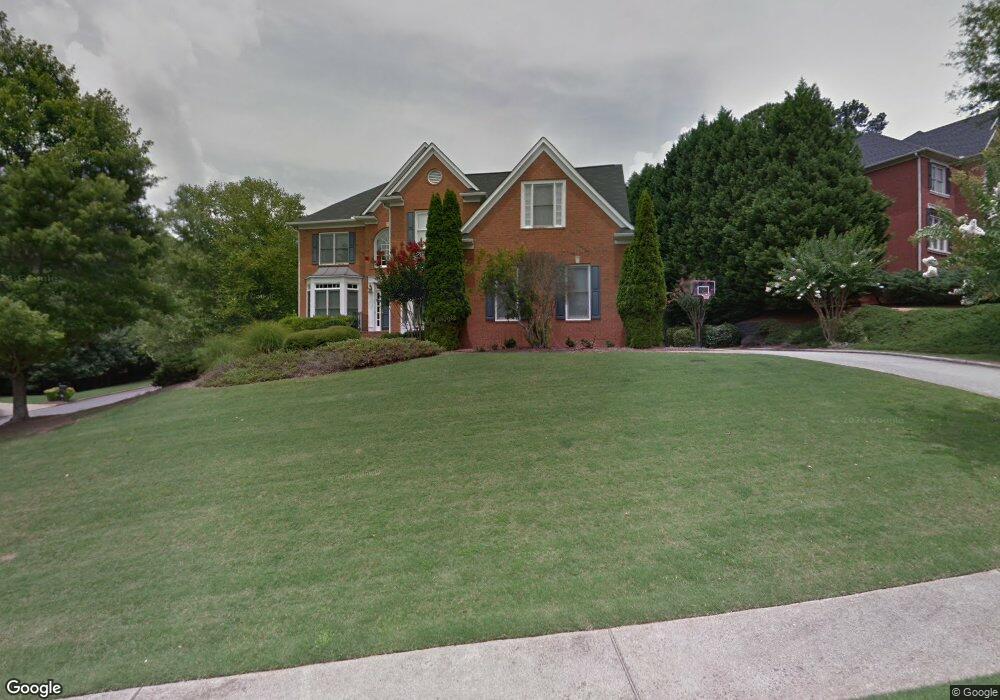
8435 High Hampton Chase Unit III Alpharetta, GA 30022
Estimated Value: $1,004,000 - $1,145,685
5
Beds
5
Baths
3,191
Sq Ft
$333/Sq Ft
Est. Value
About This Home
This home is located at 8435 High Hampton Chase Unit III, Alpharetta, GA 30022 and is currently estimated at $1,061,171, approximately $332 per square foot. 8435 High Hampton Chase Unit III is a home located in Fulton County with nearby schools including Dolvin Elementary School, Autrey Mill Middle School, and Johns Creek High School.
Ownership History
Date
Name
Owned For
Owner Type
Purchase Details
Closed on
May 11, 2007
Sold by
Darnell Terence M
Bought by
Darnell Terence M and Darnell Philippa A
Current Estimated Value
Home Financials for this Owner
Home Financials are based on the most recent Mortgage that was taken out on this home.
Original Mortgage
$60,000
Outstanding Balance
$36,396
Interest Rate
6.12%
Mortgage Type
New Conventional
Estimated Equity
$1,024,775
Purchase Details
Closed on
Aug 7, 2001
Sold by
Ballard Robert R and Ballard Amy M
Bought by
Darnell Terence
Home Financials for this Owner
Home Financials are based on the most recent Mortgage that was taken out on this home.
Original Mortgage
$255,000
Interest Rate
6.38%
Mortgage Type
New Conventional
Purchase Details
Closed on
Oct 25, 1996
Sold by
John Wieland Homes Inc
Bought by
Ballard Robert R Amy M
Create a Home Valuation Report for This Property
The Home Valuation Report is an in-depth analysis detailing your home's value as well as a comparison with similar homes in the area
Home Values in the Area
Average Home Value in this Area
Purchase History
| Date | Buyer | Sale Price | Title Company |
|---|---|---|---|
| Darnell Terence M | -- | -- | |
| Darnell Terence | $470,000 | -- | |
| Ballard Robert R Amy M | $329,800 | -- |
Source: Public Records
Mortgage History
| Date | Status | Borrower | Loan Amount |
|---|---|---|---|
| Open | Darnell Terence M | $60,000 | |
| Previous Owner | Darnell Terence | $255,000 | |
| Closed | Ballard Robert R Amy M | $0 |
Source: Public Records
Tax History Compared to Growth
Tax History
| Year | Tax Paid | Tax Assessment Tax Assessment Total Assessment is a certain percentage of the fair market value that is determined by local assessors to be the total taxable value of land and additions on the property. | Land | Improvement |
|---|---|---|---|---|
| 2025 | $1,016 | $343,160 | $114,280 | $228,880 |
| 2023 | $8,330 | $295,120 | $70,760 | $224,360 |
| 2022 | $4,652 | $245,960 | $43,400 | $202,560 |
| 2021 | $5,406 | $204,080 | $53,120 | $150,960 |
| 2020 | $5,370 | $194,360 | $51,880 | $142,480 |
| 2019 | $770 | $180,240 | $39,360 | $140,880 |
| 2018 | $5,353 | $205,320 | $34,560 | $170,760 |
| 2017 | $4,276 | $158,520 | $45,960 | $112,560 |
| 2016 | $4,276 | $158,520 | $45,960 | $112,560 |
| 2015 | $5,004 | $158,520 | $45,960 | $112,560 |
| 2014 | $4,468 | $158,520 | $45,960 | $112,560 |
Source: Public Records
Map
Nearby Homes
- 725 High Hampton Run
- 3335 Waters Mill Dr
- 335 Stanyan Place Unit 2
- 10505 Ash Rill Dr
- 3273 Long Indian Creek Ct
- 225 Wentworth Terrace
- 3430 Waters Mill Dr
- 3396 Carverton Ln
- 10421 Park Walk Point
- 1050 Ambrose Ave Unit 1
- 10530 Haynes Forest Dr
- 305 Birch Rill Dr
- 825 Highland Bend Cove
- 3077 Haynes Trail
- 3073 Haynes Trail
- 130 Forrest View Terrace
- 10255 Old Woodland Entry
- 300 Olmstead Way
- 8425 High Hampton Chase
- 700 High Hampton Run Unit 3
- 715 High Hampton Run
- 8415 High Hampton Chase
- 8430 High Hampton Chase Unit 3
- 710 High Hampton Run
- 8450 High Hampton Chase
- 8440 High Hampton Chase
- 8420 High Hampton Chase Unit 3
- 8465 High Hampton Chase
- 1820 Hill Chase
- 8460 High Hampton Chase
- 1810 Hill Chase
- 8410 High Hampton Chase
- 1830 Hill Chase Unit V
- 8405 High Hampton Chase
- 8475 High Hampton Chase Unit III
- 510 Scranton Ct
- 1840 Hill Chase
- 8485 High Hampton Chase