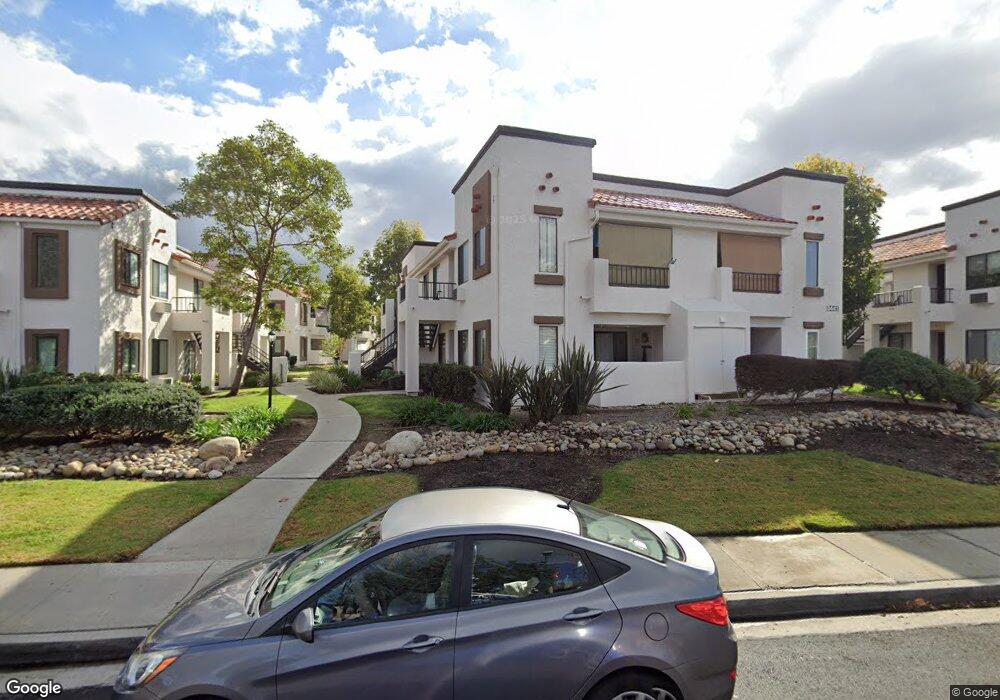
8435 Westmore Rd Unit 86 San Diego, CA 92126
Mira Mesa NeighborhoodEstimated Value: $407,883 - $441,000
1
Bed
1
Bath
572
Sq Ft
$740/Sq Ft
Est. Value
About This Home
This home is located at 8435 Westmore Rd Unit 86, San Diego, CA 92126 and is currently estimated at $423,221, approximately $739 per square foot. 8435 Westmore Rd Unit 86 is a home located in San Diego County with nearby schools including Ericson Elementary School, Wangenheim Middle School, and Mira Mesa High School.
Ownership History
Date
Name
Owned For
Owner Type
Purchase Details
Closed on
Mar 24, 1999
Sold by
Roashan Masood and Roashan Sheila
Bought by
Chan Chun Hong
Current Estimated Value
Purchase Details
Closed on
Sep 10, 1997
Sold by
Fall Florence G & Falll Trust
Bought by
Roashan Masood and Roashan Sheila
Home Financials for this Owner
Home Financials are based on the most recent Mortgage that was taken out on this home.
Original Mortgage
$30,000
Interest Rate
7.44%
Mortgage Type
Purchase Money Mortgage
Purchase Details
Closed on
Jul 20, 1996
Sold by
Fall Trust 08-07-90
Bought by
Fall Florence G
Purchase Details
Closed on
Jan 23, 1984
Create a Home Valuation Report for This Property
The Home Valuation Report is an in-depth analysis detailing your home's value as well as a comparison with similar homes in the area
Home Values in the Area
Average Home Value in this Area
Purchase History
| Date | Buyer | Sale Price | Title Company |
|---|---|---|---|
| Chan Chun Hong | $65,000 | New Century Title Company | |
| Roashan Masood | $58,000 | First American Title | |
| Fall Florence G | -- | First American Title | |
| Fall Florence G | -- | -- | |
| -- | $57,300 | -- |
Source: Public Records
Mortgage History
| Date | Status | Borrower | Loan Amount |
|---|---|---|---|
| Previous Owner | Roashan Masood | $30,000 |
Source: Public Records
Tax History Compared to Growth
Tax History
| Year | Tax Paid | Tax Assessment Tax Assessment Total Assessment is a certain percentage of the fair market value that is determined by local assessors to be the total taxable value of land and additions on the property. | Land | Improvement |
|---|---|---|---|---|
| 2025 | $1,271 | $101,871 | $59,427 | $42,444 |
| 2024 | $1,271 | $99,874 | $58,262 | $41,612 |
| 2023 | $1,242 | $97,917 | $57,120 | $40,797 |
| 2022 | $1,209 | $95,998 | $56,000 | $39,998 |
| 2021 | $1,200 | $94,116 | $54,902 | $39,214 |
| 2020 | $1,186 | $93,152 | $54,340 | $38,812 |
| 2019 | $1,165 | $91,326 | $53,275 | $38,051 |
| 2018 | $1,091 | $89,536 | $52,231 | $37,305 |
| 2017 | $1,063 | $87,781 | $51,207 | $36,574 |
| 2016 | $1,046 | $86,060 | $50,203 | $35,857 |
| 2015 | $1,031 | $84,768 | $49,449 | $35,319 |
| 2014 | $1,015 | $83,109 | $48,481 | $34,628 |
Source: Public Records
Map
Nearby Homes
- 8479 Westmore Rd Unit 55
- 8480 New Salem St Unit 103
- 8353 Summerdale Rd Unit A
- 8365 Westmore Rd Unit 20
- 10875 Camino Ruiz Unit 50
- 8509 Summerdale Rd Unit 365
- 8378 New Salem St Unit 24
- 8503 Summerdale Rd Unit 376
- 8446 Summerdale Rd Unit D
- 8388 Summerdale Rd Unit B
- 8595 Summerdale Rd Unit 170
- 11034 Sagittarius Rd
- 8333 Calle Calzada
- 8644 New Salem St Unit 6
- 10794 Westonhill Dr
- 11096 Sagittarius Rd
- 8468 Calle Morelos
- 14331 Montano Way
- 14649 Dunleer Way
- 14633 Dunleer Way
- 8445 Westmore Rd Unit 91
- 8435 Westmore Rd Unit 84
- 8435 Westmore Rd Unit 83
- 8435 Westmore Rd Unit 82
- 8435 Westmore Rd Unit 81
- 8445 Westmore Rd Unit 96
- 8445 Westmore Rd Unit 95
- 8445 Westmore Rd Unit 94
- 8445 Westmore Rd Unit 93
- 8445 Westmore Rd Unit 92
- 8445 Westmore Rd Unit 90
- 8445 Westmore Rd Unit 89
- 8435 Westmore Rd Unit 88
- 8435 Westmore Rd Unit 87
- 8435 Westmore Rd Unit 85
- 8455 Westmore Rd
- 8455 Westmore Rd
- 8455 Westmore Rd Unit 104
- 8455 Westmore Rd Unit 103
- 8455 Westmore Rd Unit 102